Fig. 14
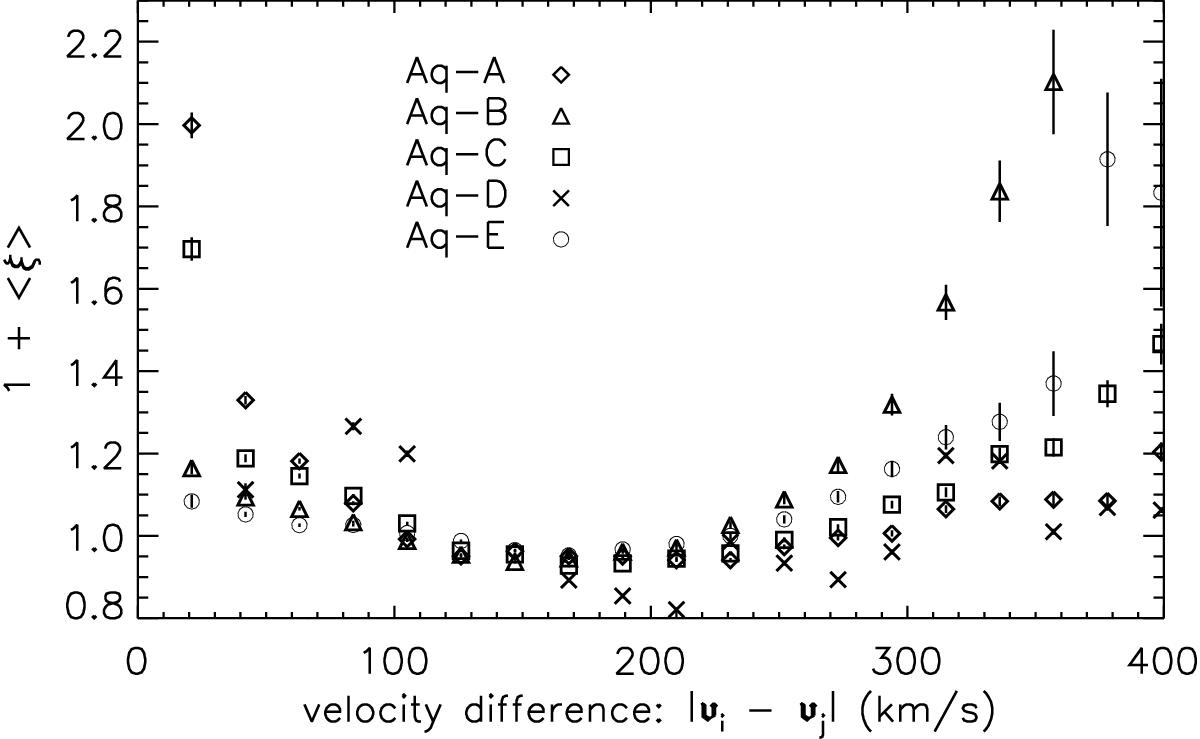
Velocity correlation function for a sample of “stars” extracted from the stellar halos in the Aquarius simulations (Lowing et al. 2015). The stars are located in a sphere of 2.8 kpc and have magnitudes in the range 8 ≤ G ≤ 12.5. The sample size is the same as our observed halo dataset. A comparison to Fig. 3 shows a similar excess of pairs in the simulations as in the data, although there is some variance in the simulations.
Current usage metrics show cumulative count of Article Views (full-text article views including HTML views, PDF and ePub downloads, according to the available data) and Abstracts Views on Vision4Press platform.
Data correspond to usage on the plateform after 2015. The current usage metrics is available 48-96 hours after online publication and is updated daily on week days.
Initial download of the metrics may take a while.