Fig. 2
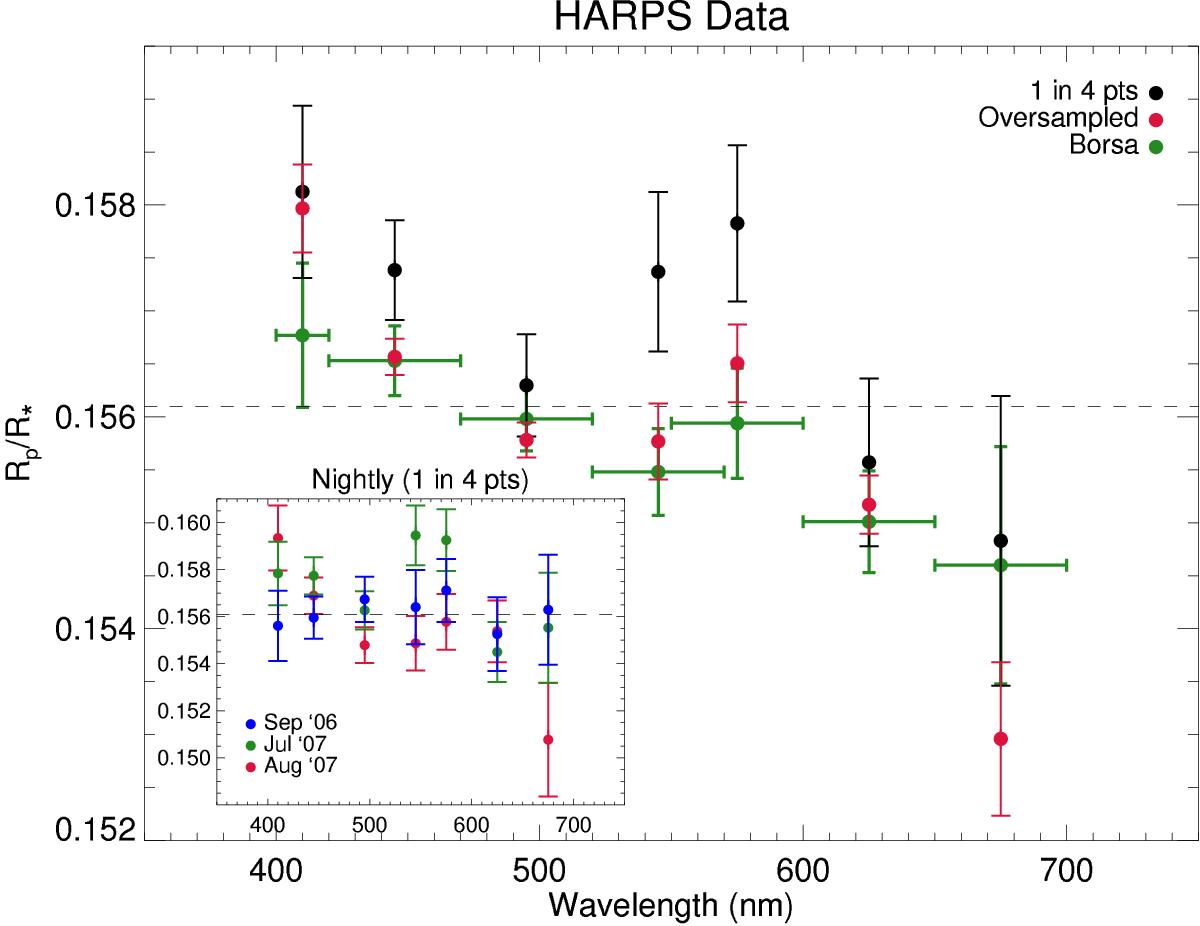
Recovered average planet radius, Rp, for each passband as a function of wavelength for the observed HARPS data. Results from B16 are shown in green (where the wavelength error bars represent the passband wavelength region), and those from our reanalysis are shown in red when using the oversampled CCF and in black when using only every one in four points in the CCF. Subplot: the nightly recovered Rp when using only every one in four points in the CCF (night indicated by colour). The horizontal dashed lines show the mean Rp recovered by the B16 method on the simulated data (i.e. the solid black points in Fig. 1).
Current usage metrics show cumulative count of Article Views (full-text article views including HTML views, PDF and ePub downloads, according to the available data) and Abstracts Views on Vision4Press platform.
Data correspond to usage on the plateform after 2015. The current usage metrics is available 48-96 hours after online publication and is updated daily on week days.
Initial download of the metrics may take a while.