Fig. 1
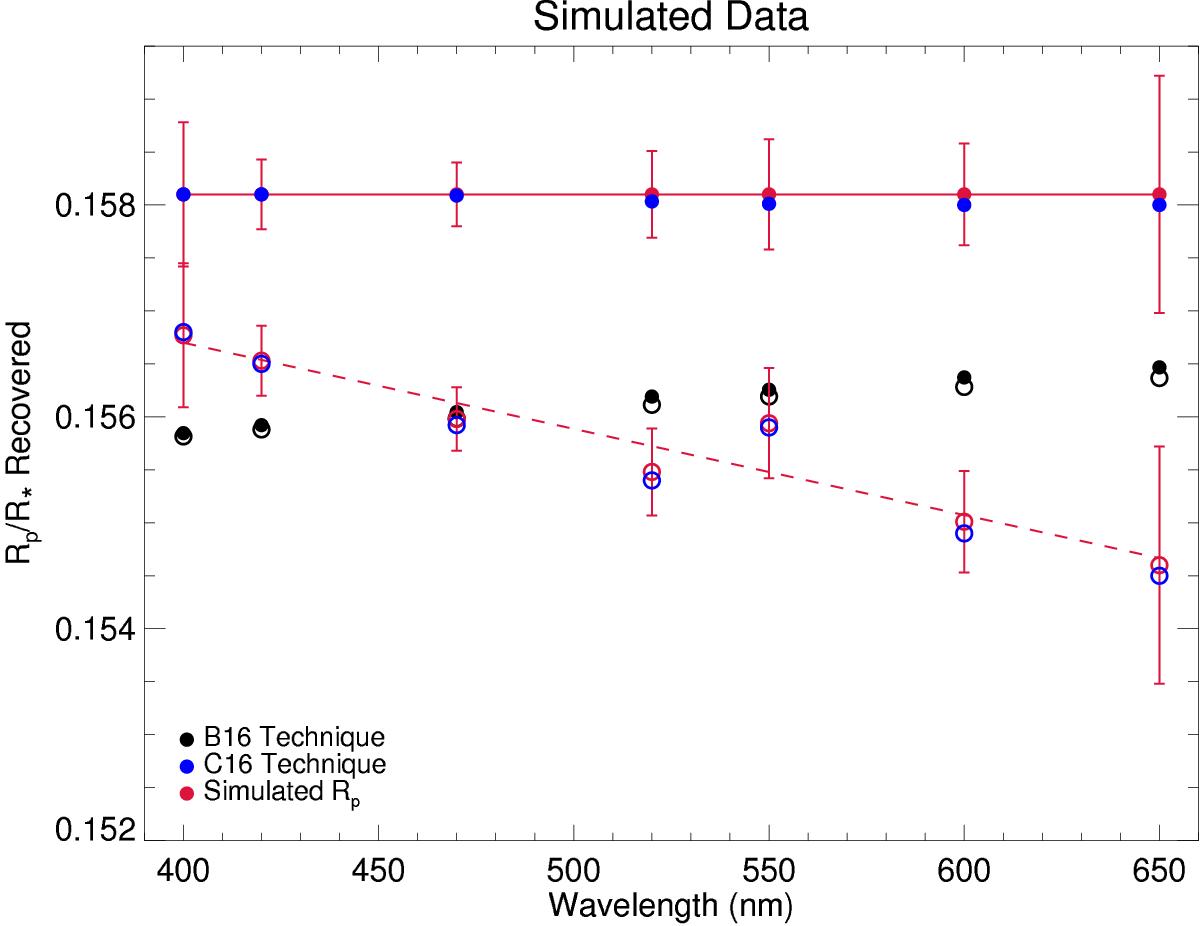
Recovered average planet radius, Rp, from the simulated data for each passband as a function of wavelength (plotted using the middle wavelength in the passband). Filled circles represent when the simulated Rp was constant, and hollow circles represent when the simulated Rp varied; in both cases these are shown in red with the error bars reported by B16 for comparison purposes only. Results from the B16 procedure are shown in black, while those from the numerical approximation herein and the C16 formulation are in blue. The lines represent linear fits to the simulated Rp shown for viewing ease.
Current usage metrics show cumulative count of Article Views (full-text article views including HTML views, PDF and ePub downloads, according to the available data) and Abstracts Views on Vision4Press platform.
Data correspond to usage on the plateform after 2015. The current usage metrics is available 48-96 hours after online publication and is updated daily on week days.
Initial download of the metrics may take a while.