Fig. 3
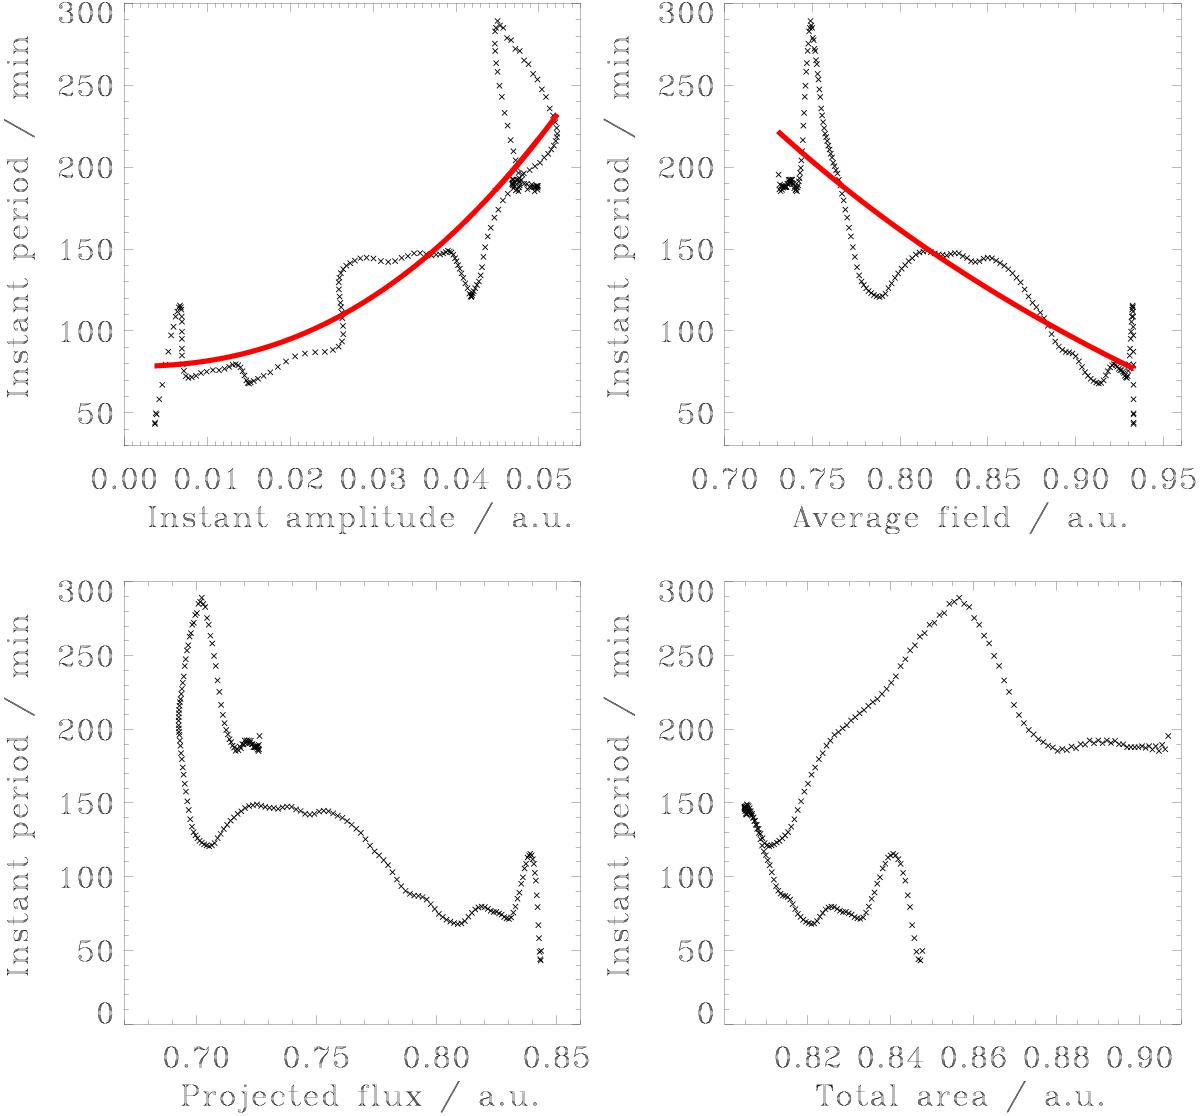
Top left: dependence of the instantaneous oscillation period upon the instantaneous oscillation amplitude in mode 8 shown inthe right-hand panel of Fig. 2. The red solid line indicates the best fit of the empirical period-amplitude dependence by a power-law function (see Sect. 3 for the fitting details). Top right: dependence of the instantaneous period of mode 8 upon the long-term trend of the average magnetic field signal, shown in the right-hand panel of Fig. 1. The red curve shows the best fit of the empirical dependence by the power law function with the index of –3/2. Bottom left: dependence of the instantaneous period of mode 8 upon the long-term variation of the normalised line-of-sight magnetic flux of the structure, projected onto the plane of sky. Bottom right: dependence of the instantaneous period of mode 8 upon the long-term trend of the total area signal, shown in the right-hand panel of Fig. 1.
Current usage metrics show cumulative count of Article Views (full-text article views including HTML views, PDF and ePub downloads, according to the available data) and Abstracts Views on Vision4Press platform.
Data correspond to usage on the plateform after 2015. The current usage metrics is available 48-96 hours after online publication and is updated daily on week days.
Initial download of the metrics may take a while.