Fig. 1
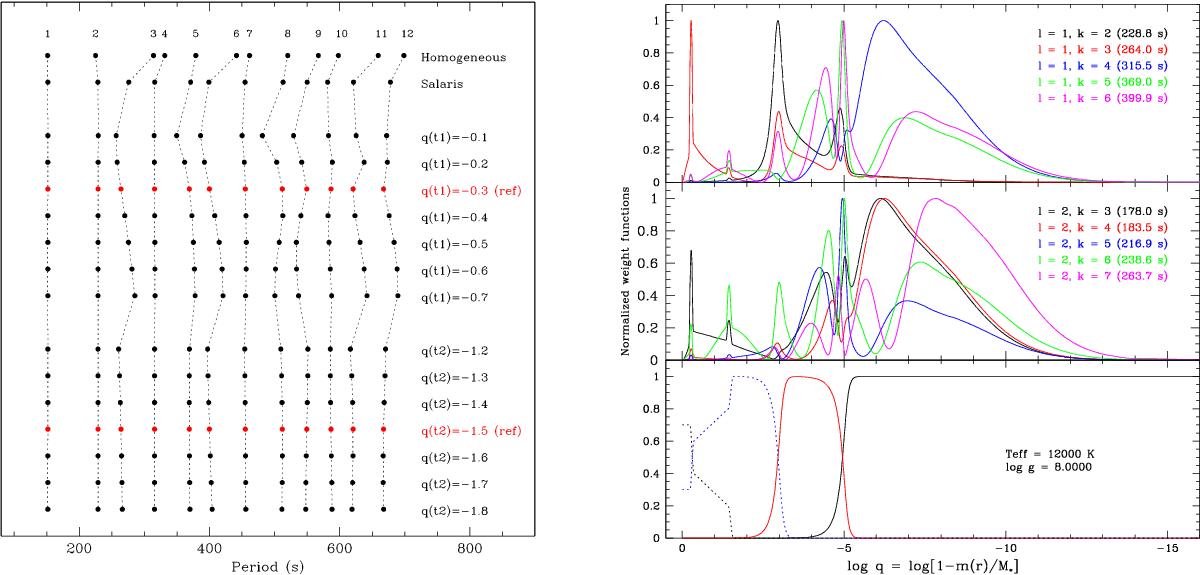
Left panel: period spectra of the ℓ = 1, k = 1–12 g-modes for a series of models with different core configurations (see text for details). Modes of same radial order are connected by a dotted line to ease following period changes. Right panel: oxygen (black dotted line), carbon (blue dotted line), helium (red solid line), and hydrogen (black solid line) stratification in the reference model (bottom panel). The top and middle panels show the weight functions for a subset of dipole (ℓ = 1) and quadrupole (ℓ = 2) g-modes computed for this reference model.
Current usage metrics show cumulative count of Article Views (full-text article views including HTML views, PDF and ePub downloads, according to the available data) and Abstracts Views on Vision4Press platform.
Data correspond to usage on the plateform after 2015. The current usage metrics is available 48-96 hours after online publication and is updated daily on week days.
Initial download of the metrics may take a while.