Fig. C.1
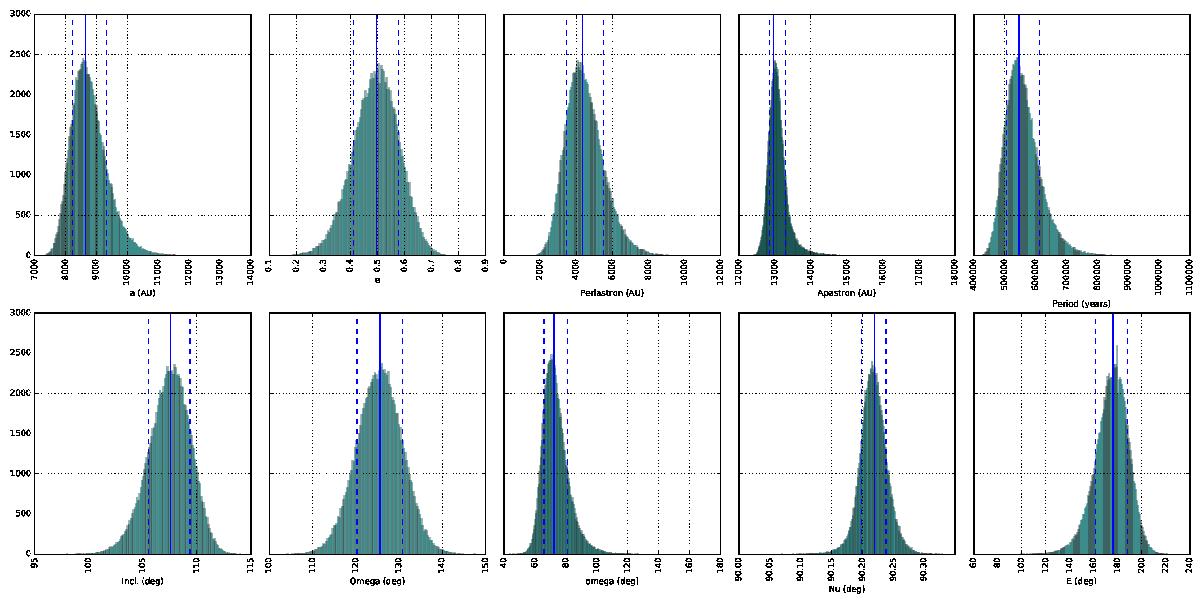
Histograms of the Monte Carlo simulations of the orbital parameters of Proxima. The solid blue line is the best fit parameter, and the dashed lines delimit the 68% confidence interval (1σ).
Current usage metrics show cumulative count of Article Views (full-text article views including HTML views, PDF and ePub downloads, according to the available data) and Abstracts Views on Vision4Press platform.
Data correspond to usage on the plateform after 2015. The current usage metrics is available 48-96 hours after online publication and is updated daily on week days.
Initial download of the metrics may take a while.