Fig. 1
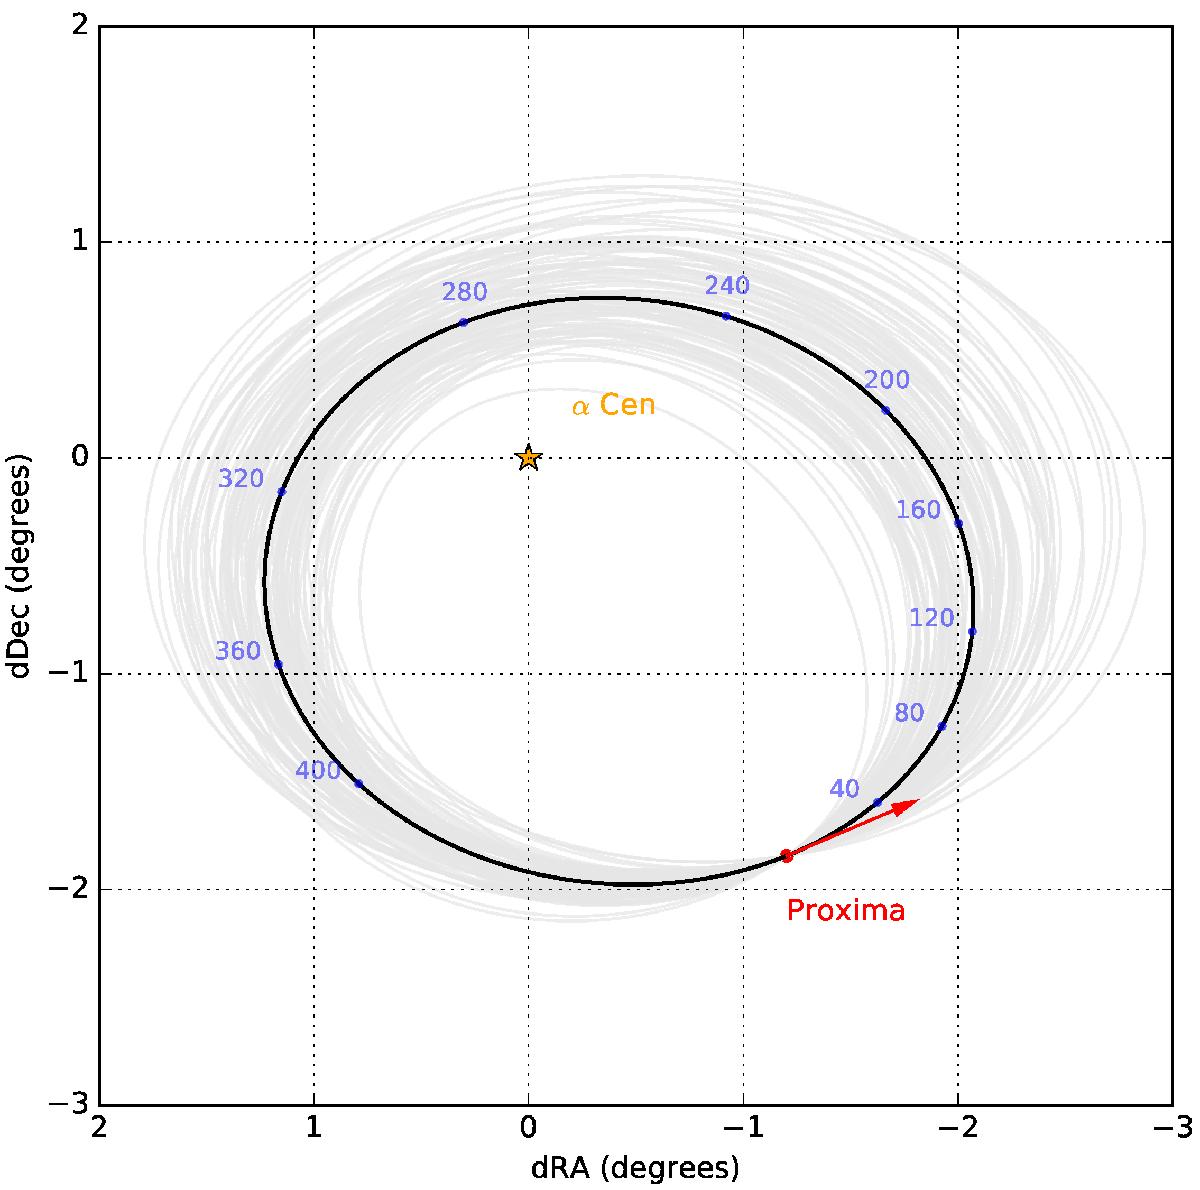
Best-fit orbit of Proxima around α Cen projected in the plane of the sky (black curve), with a set of 100 possible orbits from a Monte Carlo approach (thin gray curves). The blue dots represent the position of Proxima every 40 000 yr (labels in millenia) and the direction of the present velocity vector of Proxima is shown as a red arrow.
Current usage metrics show cumulative count of Article Views (full-text article views including HTML views, PDF and ePub downloads, according to the available data) and Abstracts Views on Vision4Press platform.
Data correspond to usage on the plateform after 2015. The current usage metrics is available 48-96 hours after online publication and is updated daily on week days.
Initial download of the metrics may take a while.