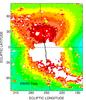
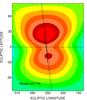
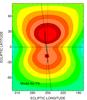
Fig. 7

Lyman-α maps of the upwind region, showing the MER and groove, as seen by an observer on the downwind position for solar minimum. We show the SWAN data for Dec. 3, 2009 (left), a simulation result calculated for this date using the Moscow full-heliospheric model (middle), and the same simulation assuming that the solar rotation axis is perfectly aligned with the ecliptic axis (right). The black crosses represent the average upwind longitude derived from this analysis for the different latitude parallels. The black line approximately traces the north-south direction on which these directions are aligned, while the dashed lines in the center and right panels show the alignment of the MER north and south lobes in the model maps. No such alignment could be precisely defined from the data maps, as there was a large gap in the data that is due to the detector shield.
Current usage metrics show cumulative count of Article Views (full-text article views including HTML views, PDF and ePub downloads, according to the available data) and Abstracts Views on Vision4Press platform.
Data correspond to usage on the plateform after 2015. The current usage metrics is available 48-96 hours after online publication and is updated daily on week days.
Initial download of the metrics may take a while.