Fig. 2
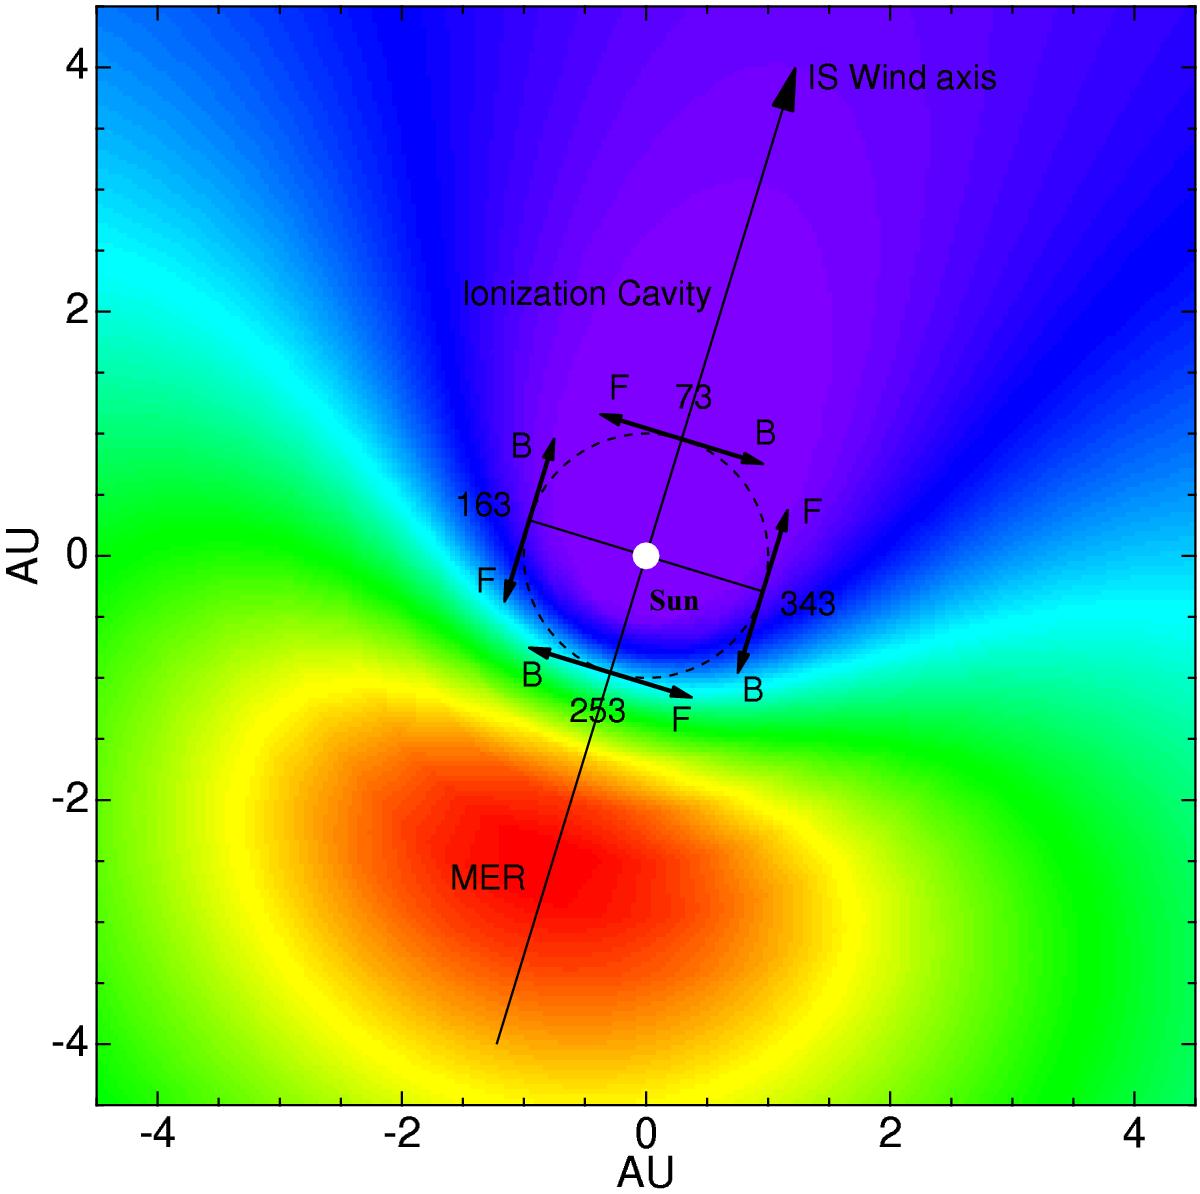
Simulated Lyman-α emissivity (color scale is in arbitrary units) within the ecliptic plane. The dashed circle shows the approximate SOHO orbit around the Sun and the small arrows show a sample of the selected lines of sight (marked F for forward and B for backward-looking w.r.t. Earth/SOHO motion) for this analysis, projected onto the ecliptic plane. A projection of the interstellar H flow axis on the ecliptic plane is also marked.
Current usage metrics show cumulative count of Article Views (full-text article views including HTML views, PDF and ePub downloads, according to the available data) and Abstracts Views on Vision4Press platform.
Data correspond to usage on the plateform after 2015. The current usage metrics is available 48-96 hours after online publication and is updated daily on week days.
Initial download of the metrics may take a while.