Fig. 6
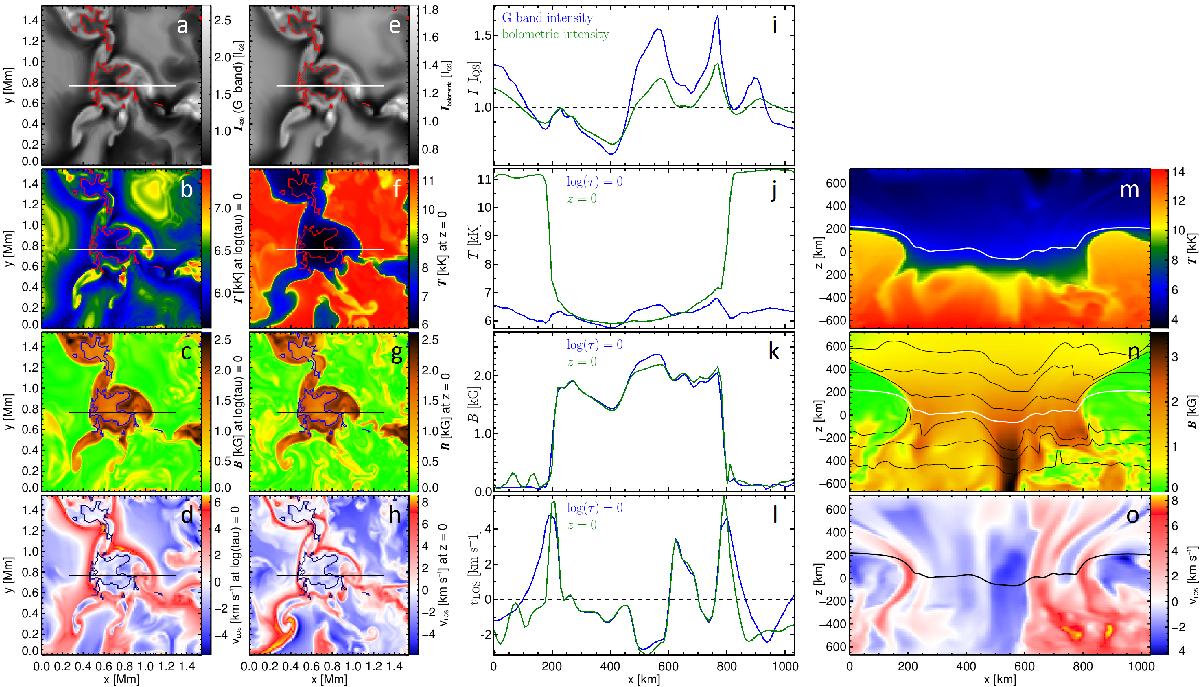
Maps of the G-band intensity (panel a)), bolometric intensity (panel e)), temperature, magnetic field strength, and line-of-sight velocity at optical depth unity (panels b)–d)) and at constant geometrical height zero (panels f)–h)) of the flux patch at (x,y) = (3.0 Mm, 5.1 Mm) in Fig. 5. Contour lines are the same as in Fig. 5. The horizontal lines mark the position of the profiles plotted in panels i)–l) (blue lines for the first column of panels a)–d) and green lines for the second column of panels e–h) and the vertical cuts displayed in panels m)–o). The optical depth unity level is marked by a white line in panels m) and n) and as a black line in panel o). The black lines in panel n) are iso-density lines. Negative velocities correspond to upflows.
Current usage metrics show cumulative count of Article Views (full-text article views including HTML views, PDF and ePub downloads, according to the available data) and Abstracts Views on Vision4Press platform.
Data correspond to usage on the plateform after 2015. The current usage metrics is available 48-96 hours after online publication and is updated daily on week days.
Initial download of the metrics may take a while.