Fig. 2
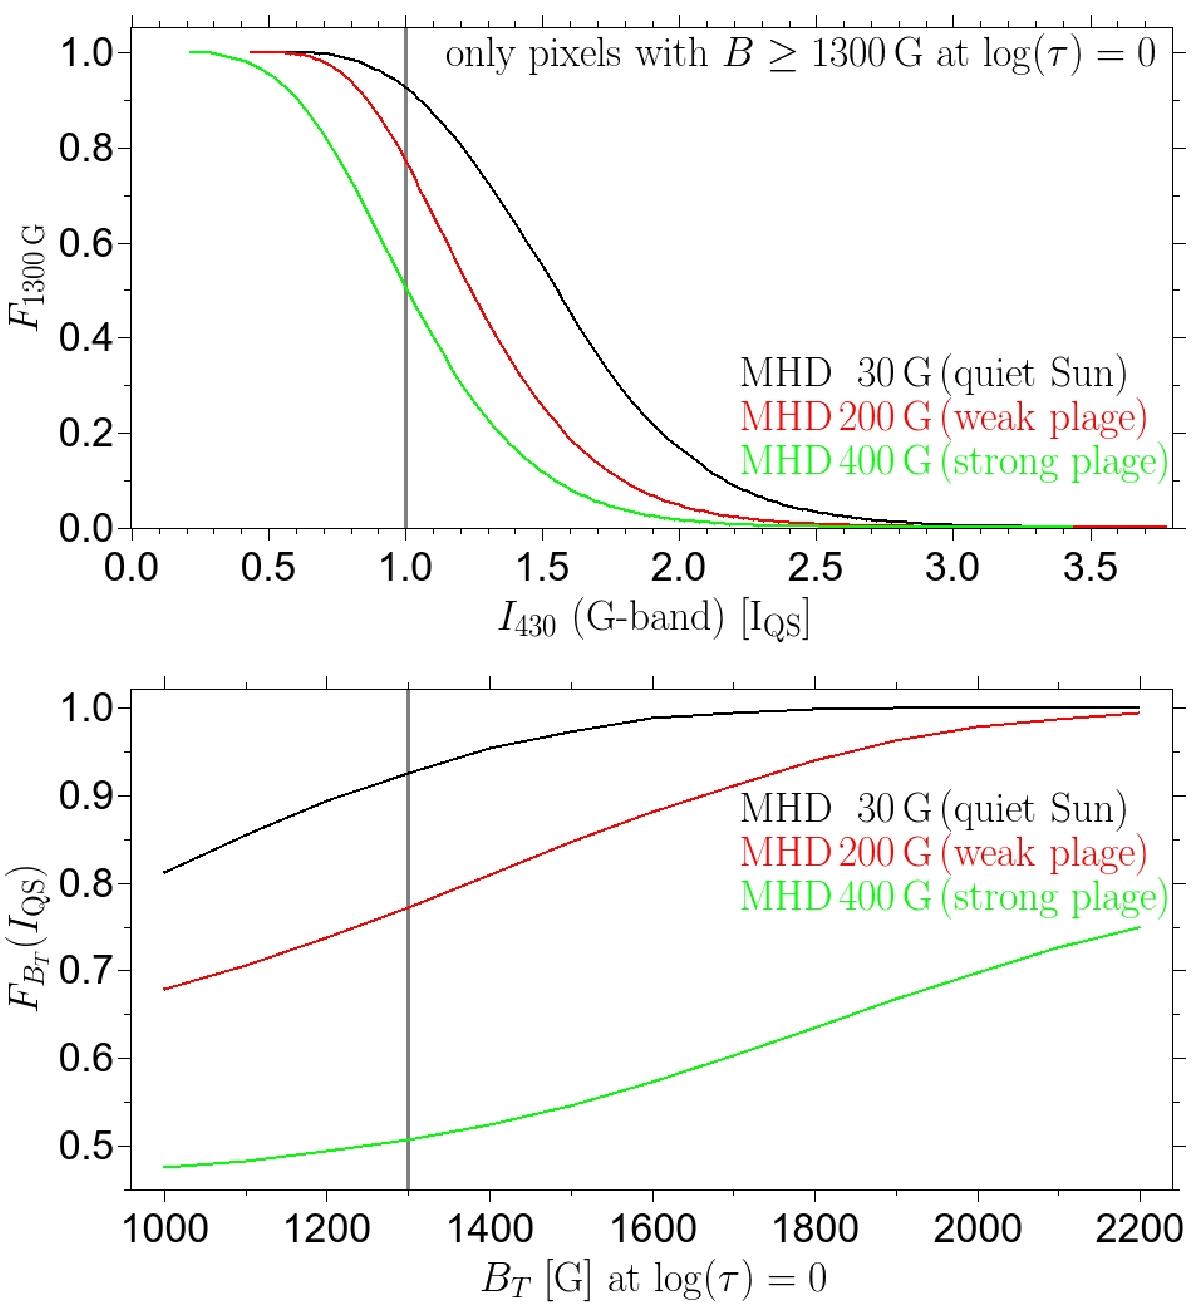
Top panel: integrated G-band intensity histograms, FBT, of strong-field pixels with B ≥ 1300 G (see main text for definition). The mean quiet-Sun intensity is indicated by the vertical line. Bottom panel: variation of FBT(IQS) with BT, where IQS is the mean quiet-Sun intensity and BT is the magnetic field threshold. FBT(IQS) gives the fraction of all pixels with a field strength greater than BT, which also have an intensity greater than IQS. The vertical line indicates the lowest BT value at optical depth unity that corresponds to a kilogauss field at the height of average line formation of Fe i 525.02 nm. The black, red, and green lines refer to the snapshots taken from the 30 G, 200 G, and 400 G simulations.
Current usage metrics show cumulative count of Article Views (full-text article views including HTML views, PDF and ePub downloads, according to the available data) and Abstracts Views on Vision4Press platform.
Data correspond to usage on the plateform after 2015. The current usage metrics is available 48-96 hours after online publication and is updated daily on week days.
Initial download of the metrics may take a while.