Free Access
Fig. 6
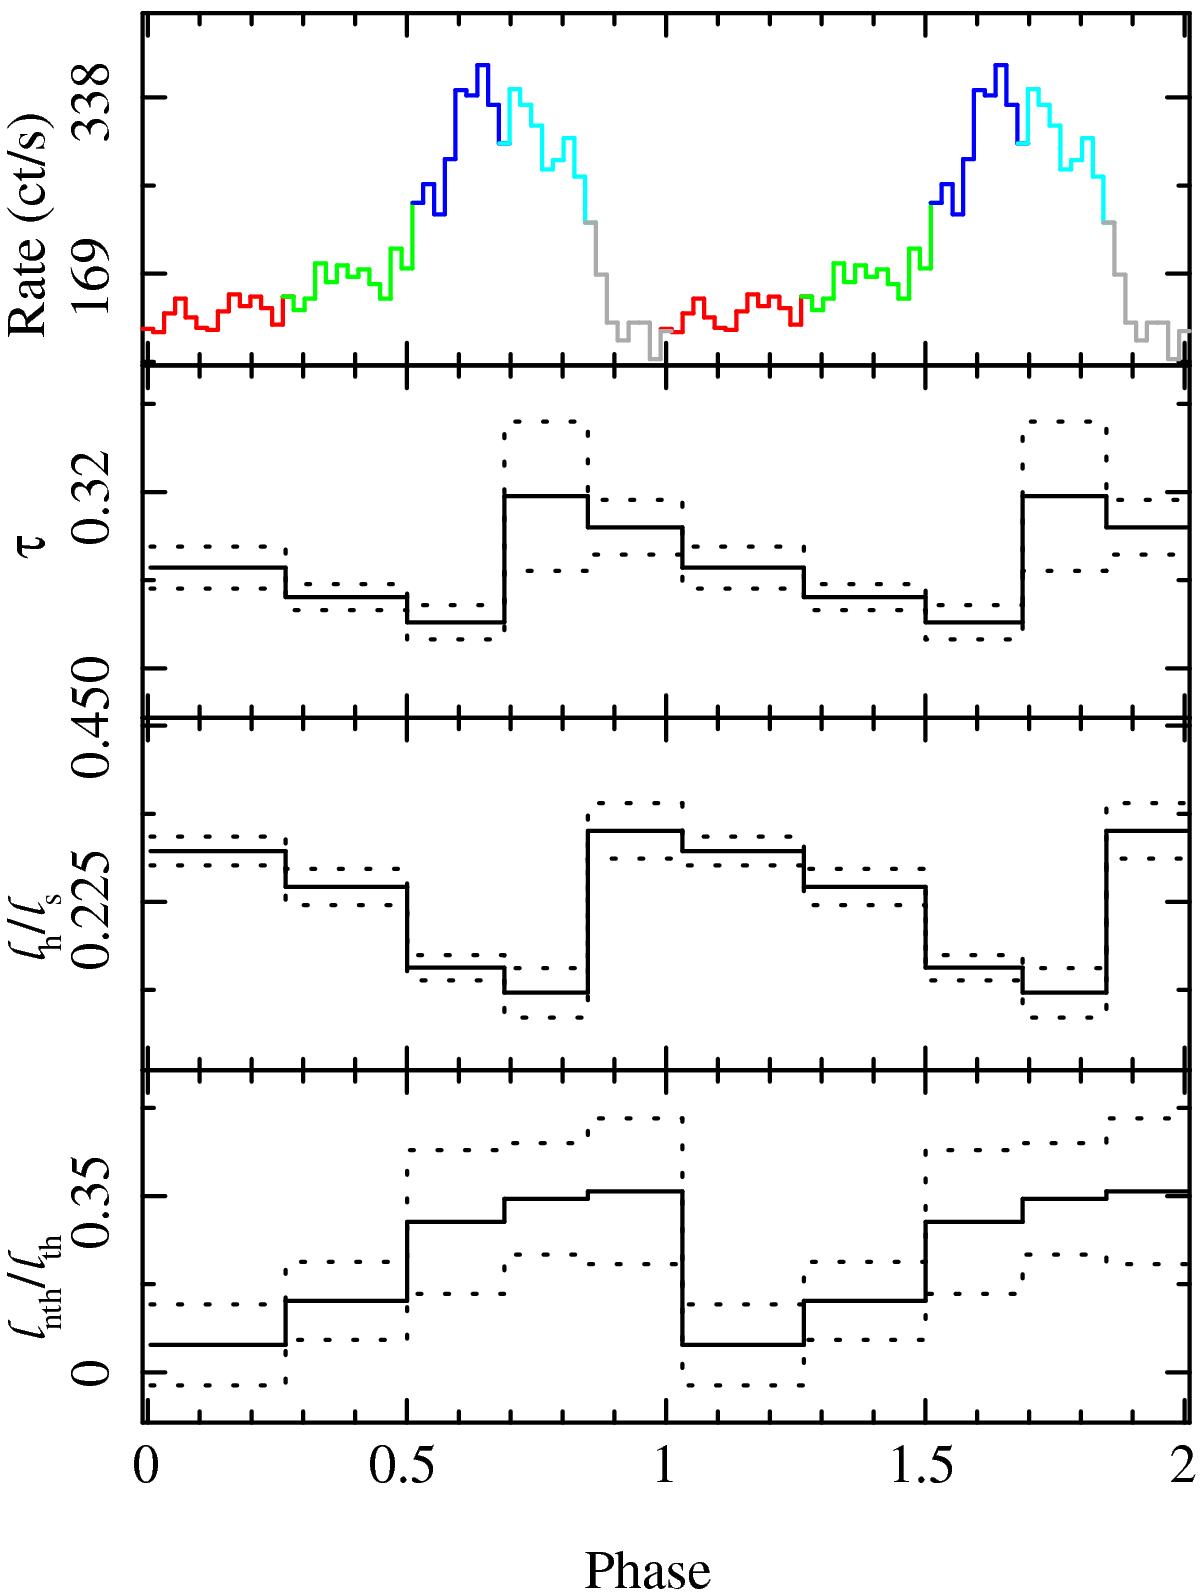
Continuous black lines indicate the average of the best fit τ (second panel), ℓh/ℓs (third panel) and ℓnt/ℓh (bottom panel) in the five intervals; dashed lines show the interval relative to the rms. For comparison, in the top panel the light curve of one burst is plotted.
Current usage metrics show cumulative count of Article Views (full-text article views including HTML views, PDF and ePub downloads, according to the available data) and Abstracts Views on Vision4Press platform.
Data correspond to usage on the plateform after 2015. The current usage metrics is available 48-96 hours after online publication and is updated daily on week days.
Initial download of the metrics may take a while.