Fig. 1
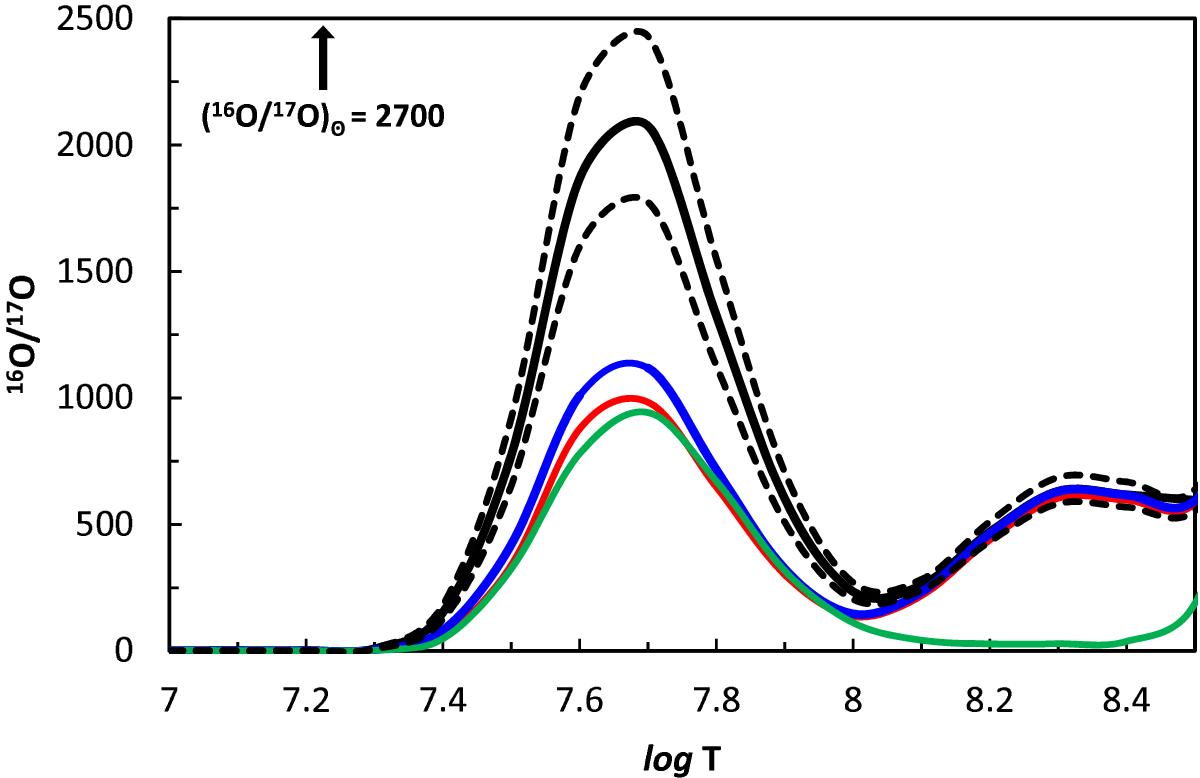
Equilibrium values of the 16O/17O vs. temperature (see Eq. (1)). The black curve was obtained by adopting the revised rate of the 17O(p, α)14N reaction (median values of Bruno et al. 2016) and the two black dashed lines show the recommended maximum and minimum values compatible with the experimental data, which corresponds to the 1σ error bar of the measured nuclear cross section. For comparisons, the blue, red, and green lines show the results obtained by adopting the 17O(p, α)14N rate from Buckner et al. (2015), Iliadis et al. (2010), and Angulo et al. (1999), respectively.
Current usage metrics show cumulative count of Article Views (full-text article views including HTML views, PDF and ePub downloads, according to the available data) and Abstracts Views on Vision4Press platform.
Data correspond to usage on the plateform after 2015. The current usage metrics is available 48-96 hours after online publication and is updated daily on week days.
Initial download of the metrics may take a while.