Fig. 10
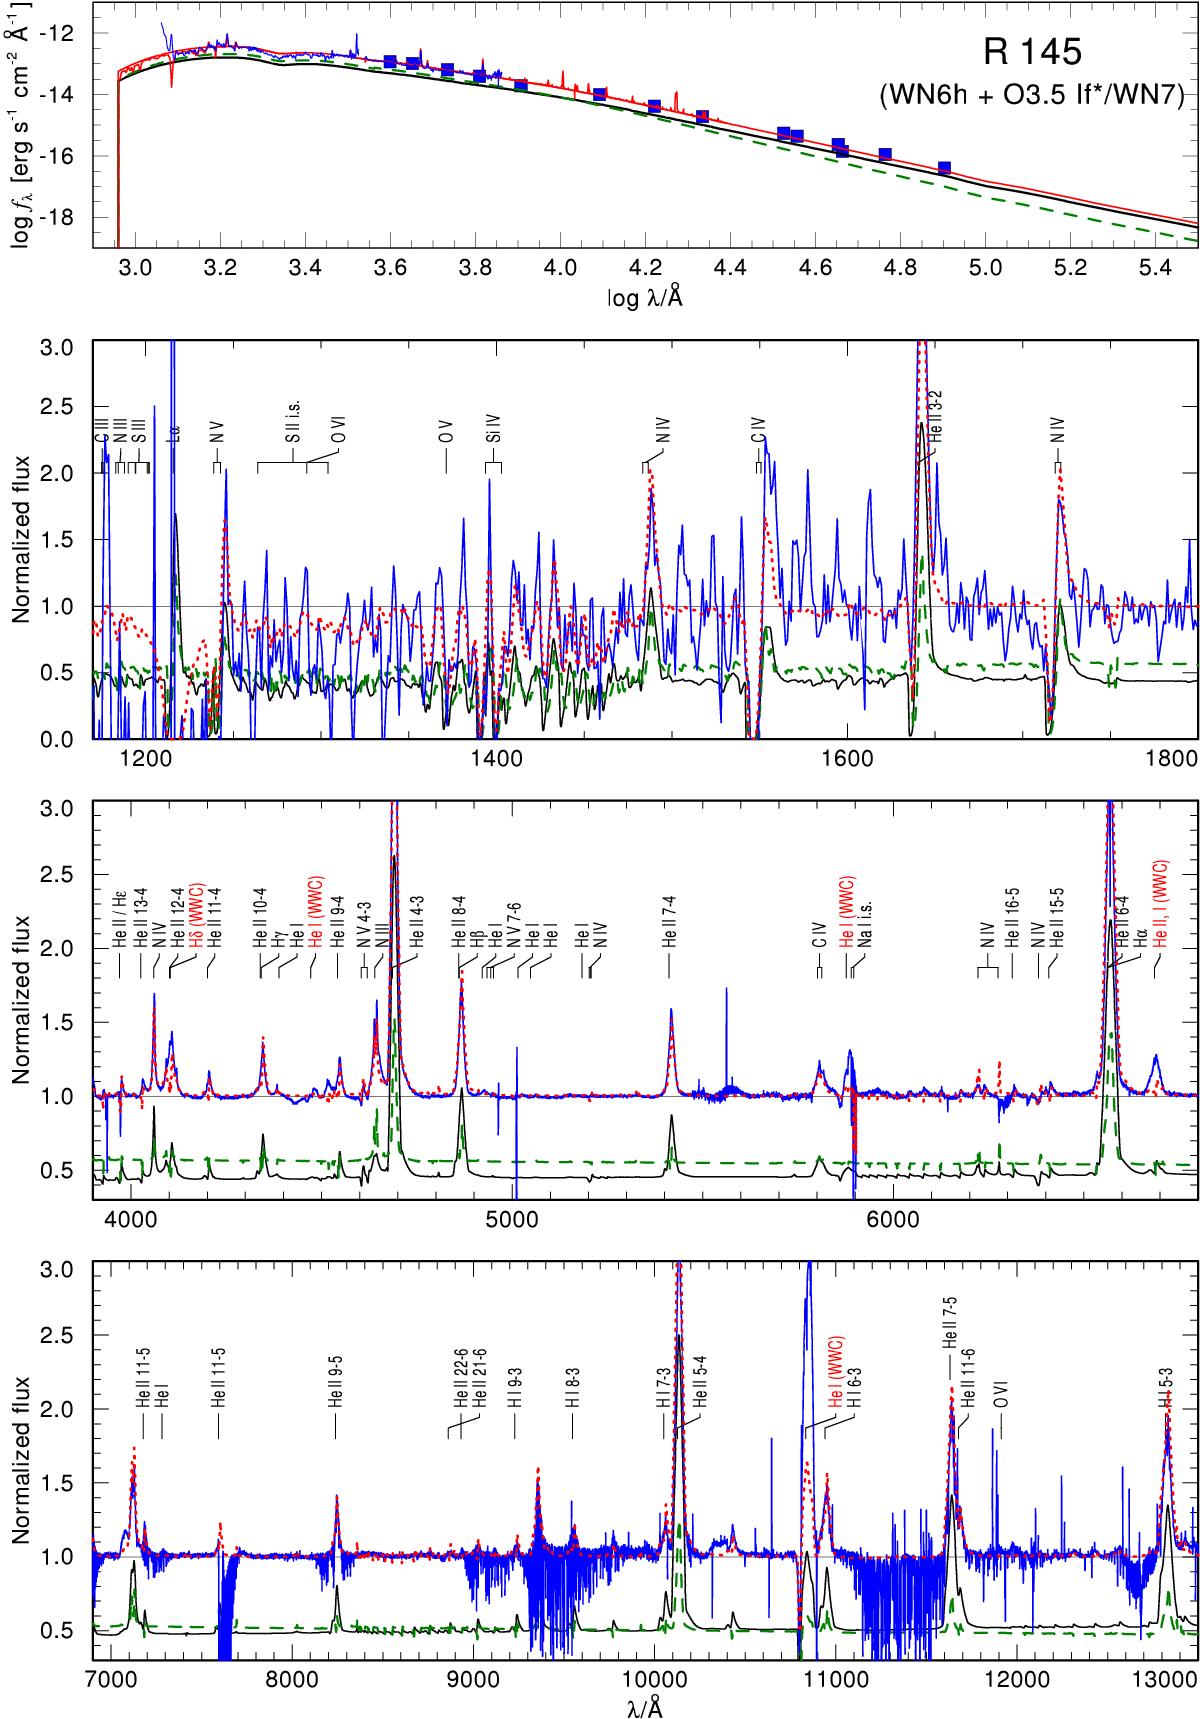
Comparison between observed (blue squares and lines) SED (upper panel) and the normalized IUE and X-shooter spectra (lower panel) and the synthetic composite spectrum (red dotted line). The composite spectrum is the sum of the primary (black solid line) and secondary (green dashed line). The observed and modeled spectra in the UV are binned at 1 Å for clarity. Lines that are strongly affected by WWC are marked with red idents.
Current usage metrics show cumulative count of Article Views (full-text article views including HTML views, PDF and ePub downloads, according to the available data) and Abstracts Views on Vision4Press platform.
Data correspond to usage on the plateform after 2015. The current usage metrics is available 48-96 hours after online publication and is updated daily on week days.
Initial download of the metrics may take a while.