Fig. 7
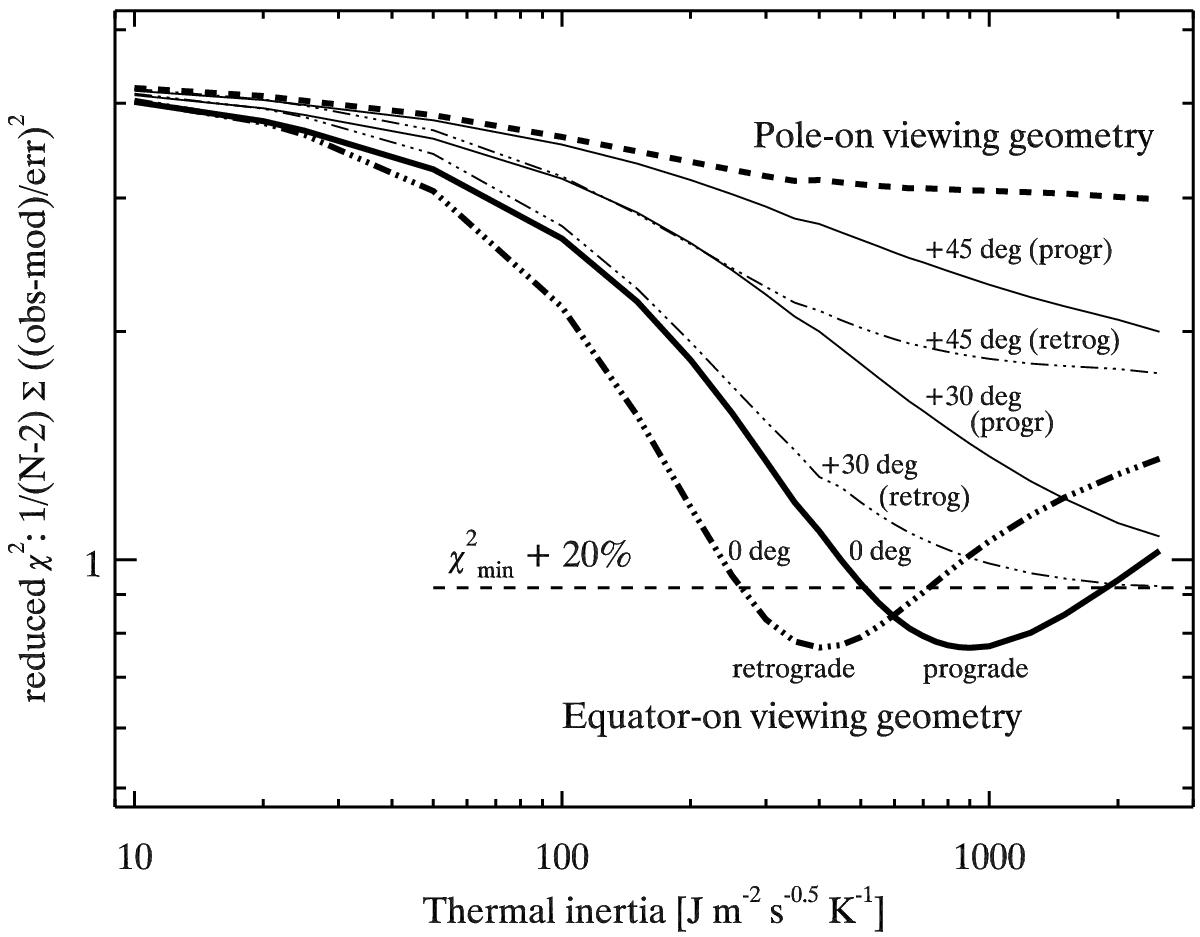
χ2 radiometric analysis of the VLT-VISIR data for a spherical shape solution, and for a range of different spin-axis orientations. The dashed horizontal line indicates a χ2 threshold 20% above the minium value. The solid lines show prograde cases (0°, +30°, and +45° from a perfect equator-on geometry), the dashed-dotted lines are calculated for the same spin-axis orientations, but for retrograde cases. The dashed curve with χ2-values above 3 shows the pole-on geometry.
Current usage metrics show cumulative count of Article Views (full-text article views including HTML views, PDF and ePub downloads, according to the available data) and Abstracts Views on Vision4Press platform.
Data correspond to usage on the plateform after 2015. The current usage metrics is available 48-96 hours after online publication and is updated daily on week days.
Initial download of the metrics may take a while.