Free Access
Fig. 1
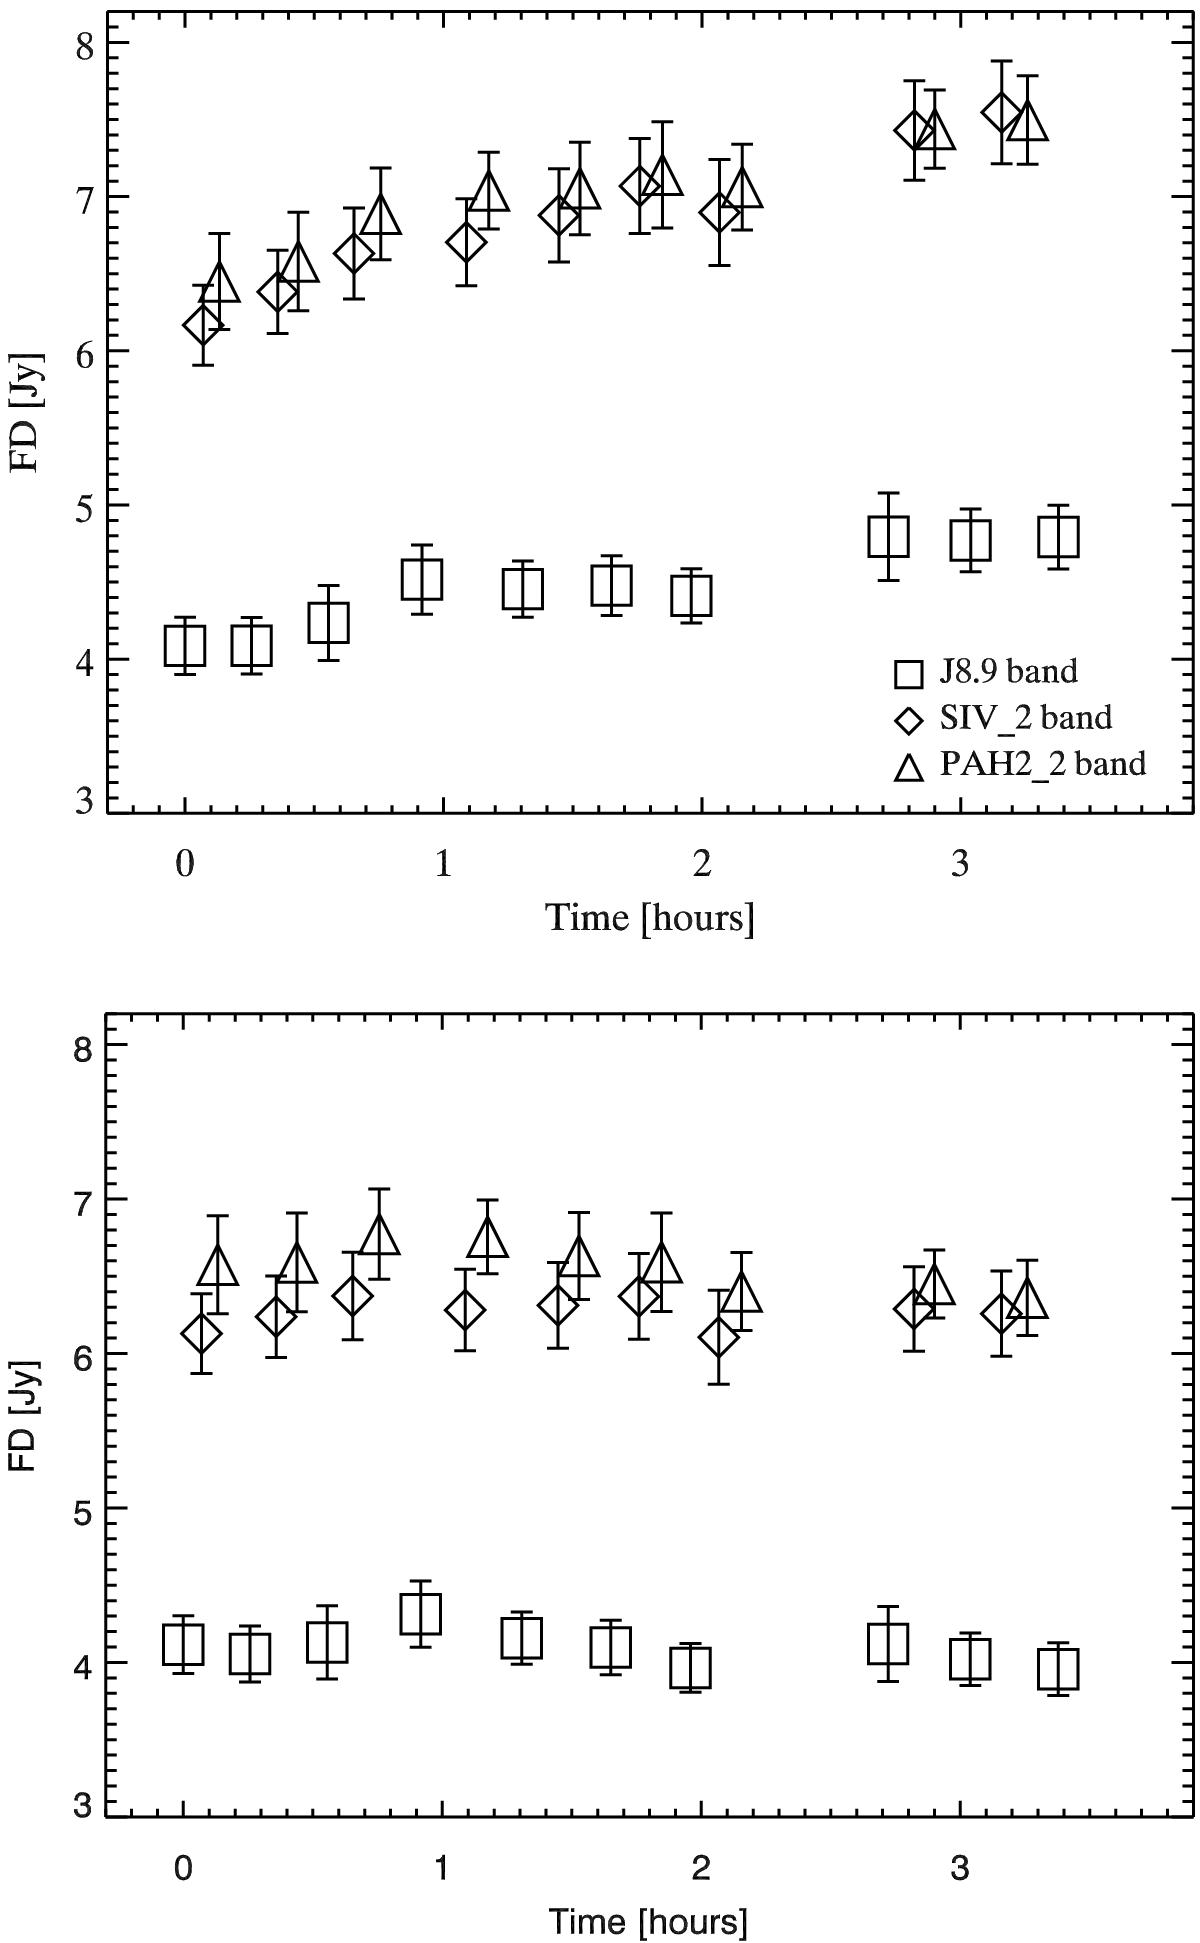
Observed and calibrated VISIR flux densities of 2015 TB145. Zero-time corresponds to Oct. 30, 2015 at 05:46 UT. Top: the flux increase with time is for the most part related to the rapidly changing observing geometry. Bottom: same fluxes, but now distance corrected to the first measurement in a given filter.
This figure is made of several images, please see below:
Current usage metrics show cumulative count of Article Views (full-text article views including HTML views, PDF and ePub downloads, according to the available data) and Abstracts Views on Vision4Press platform.
Data correspond to usage on the plateform after 2015. The current usage metrics is available 48-96 hours after online publication and is updated daily on week days.
Initial download of the metrics may take a while.