Fig. 9
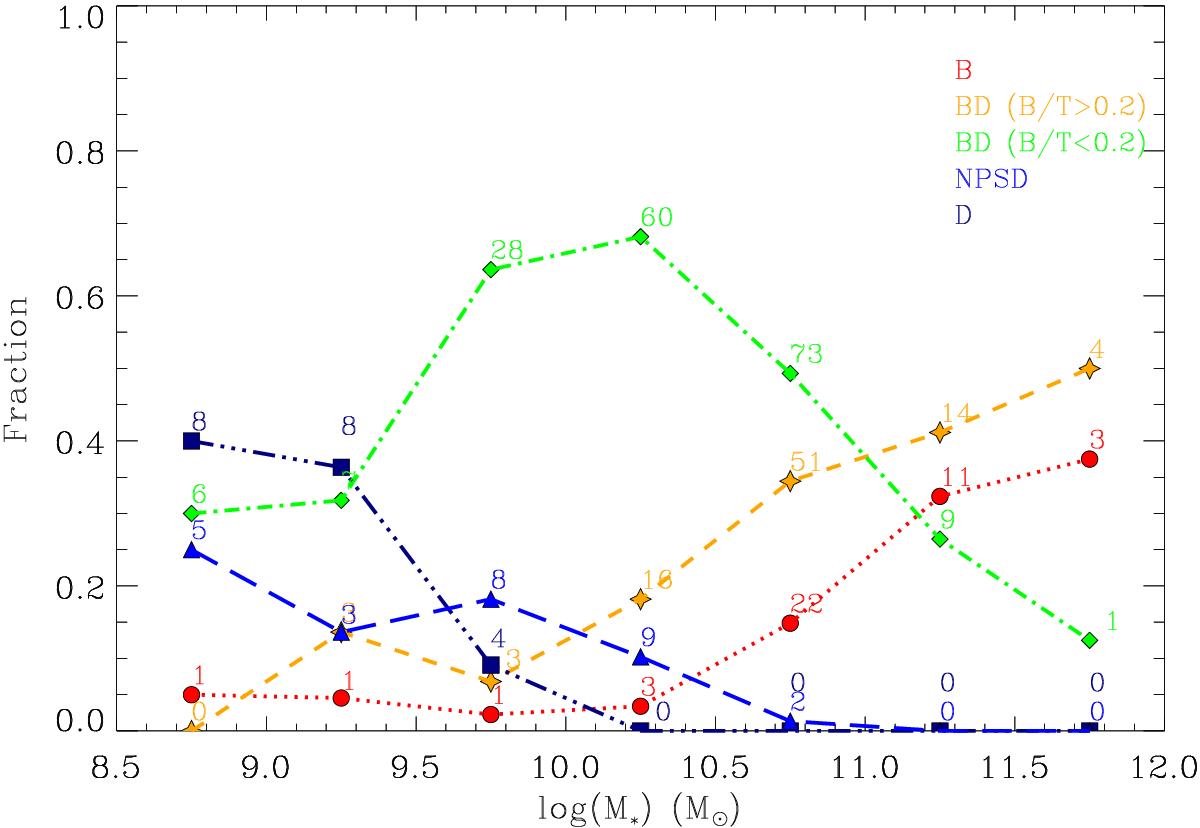
Fraction of the final models used in the photometric decomposition as a function of stellar mass. Red circles represent single Sérsic models (B). Orange stars show models composed of a bulge+disc (BD) with B/T > 0.2. Green diamonds display models composed of a bulge+disc with with B/T < 0.2. Navy blue squares show models with no bulge but pure disc (D). Blue triangles represent models with a NPS+disc (NPSD). The five different combination of structures include broken profiles and/or bars. The number of galaxies in each bin is also shown.
Current usage metrics show cumulative count of Article Views (full-text article views including HTML views, PDF and ePub downloads, according to the available data) and Abstracts Views on Vision4Press platform.
Data correspond to usage on the plateform after 2015. The current usage metrics is available 48-96 hours after online publication and is updated daily on week days.
Initial download of the metrics may take a while.