Free Access
Fig. 8
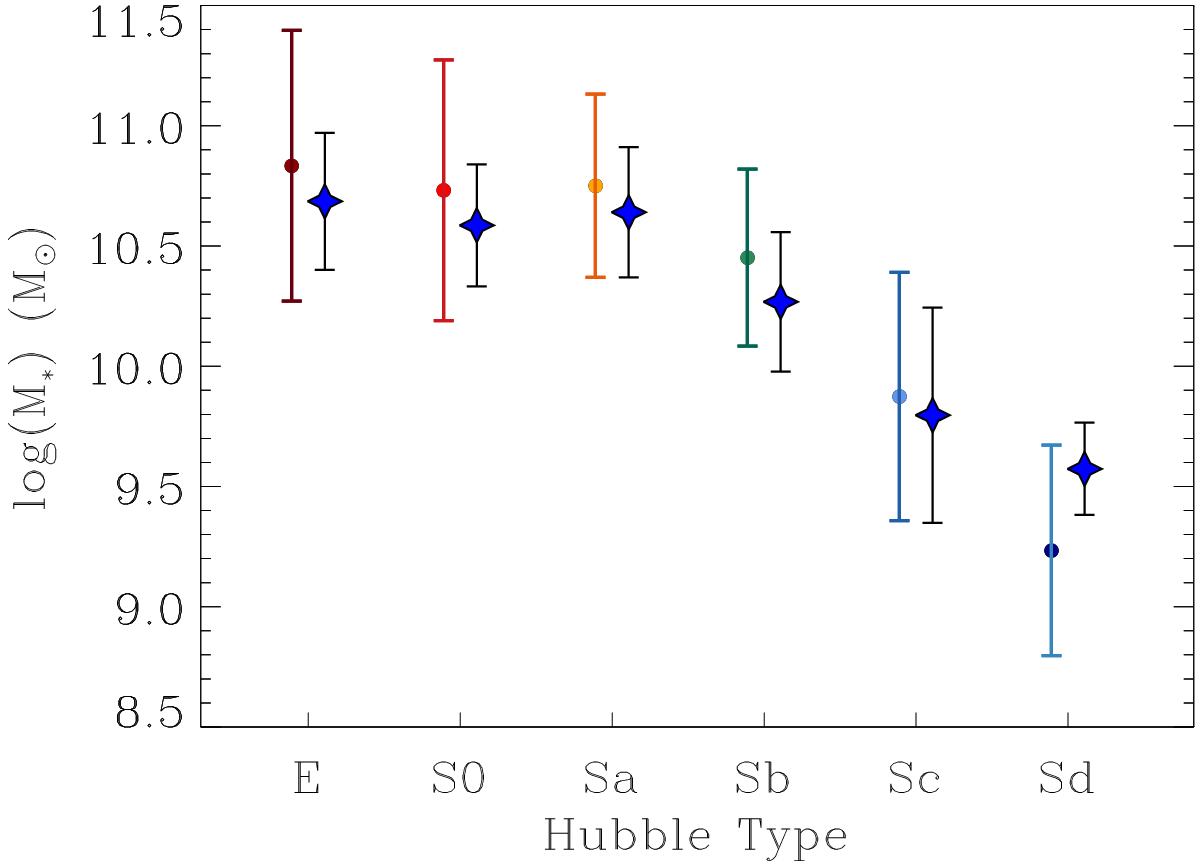
Distribution of galaxy stellar mass with Hubble type for our galaxy sample. Colour points and bars represent the mean values and 1σ error of stellar mass for the observed distributions. Blue stars show the volume-weighted mean values of the mass with its corresponding 1σ errors.
Current usage metrics show cumulative count of Article Views (full-text article views including HTML views, PDF and ePub downloads, according to the available data) and Abstracts Views on Vision4Press platform.
Data correspond to usage on the plateform after 2015. The current usage metrics is available 48-96 hours after online publication and is updated daily on week days.
Initial download of the metrics may take a while.