Fig. 7
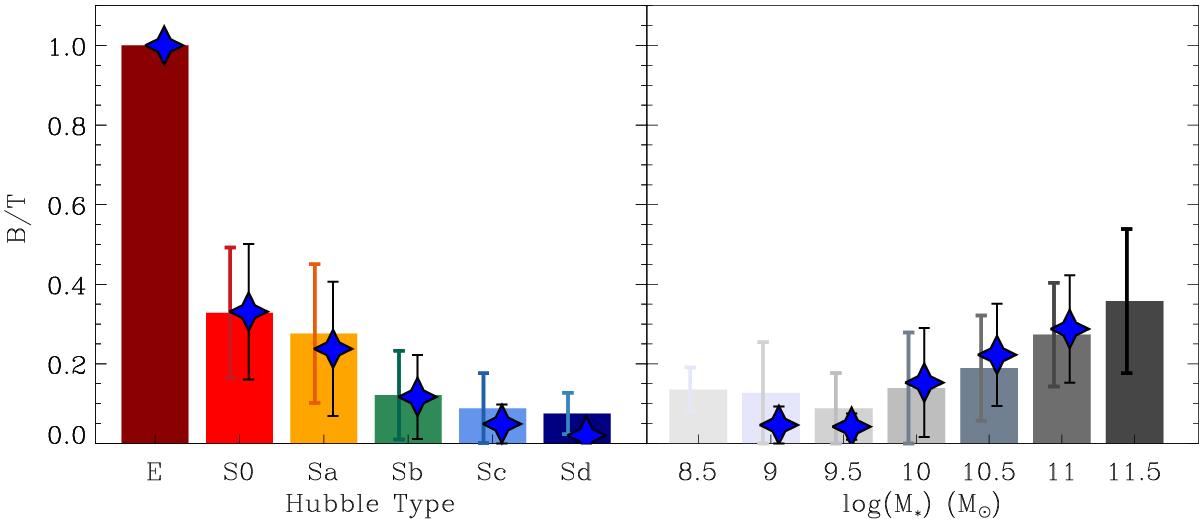
Distribution of the B/T ratio with Hubble type (left panel) and stellar mass (right panel). Colour bars represent the mean values of B/T for the observed distributions. Lines with darker colours show the 1σ error. Blue stars show the volume weighted mean values of the B/T ratios with its corresponding 1σ errors. Elliptical galaxies have been excluded from the distribution in the right panel. Bins with less than five galaxies are not represented.
Current usage metrics show cumulative count of Article Views (full-text article views including HTML views, PDF and ePub downloads, according to the available data) and Abstracts Views on Vision4Press platform.
Data correspond to usage on the plateform after 2015. The current usage metrics is available 48-96 hours after online publication and is updated daily on week days.
Initial download of the metrics may take a while.