Fig. 5
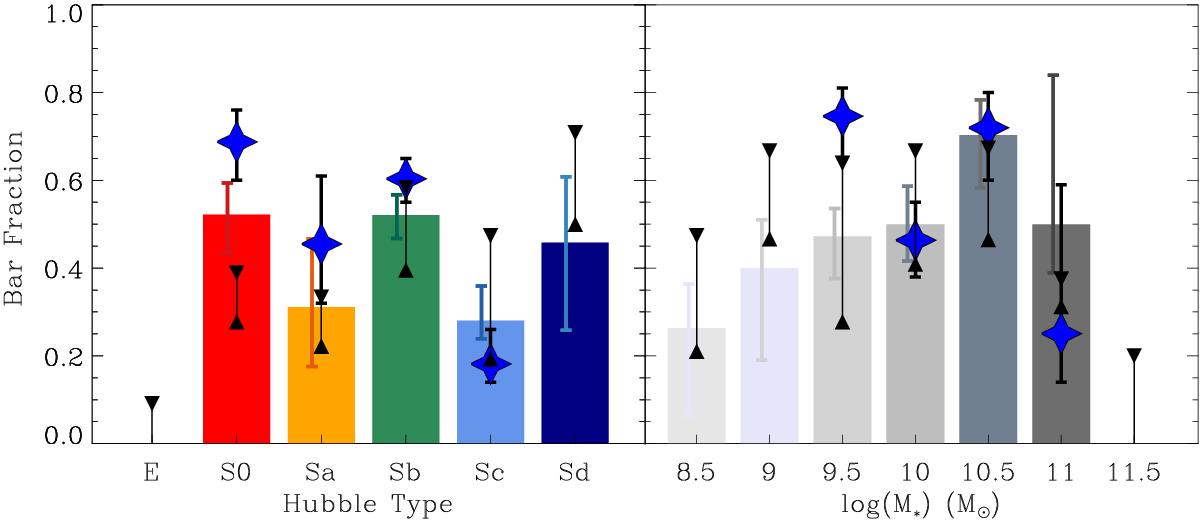
Distribution of the bar fraction as a function of the Hubble type (left panel) and stellar mass (right panel). Colour bars represent the photometric bar fraction derived from this study. Lines with darker colours show the 1σ error. Blue stars show the volume corrected bar fractions using only those galaxies drawn from the mother sample and with luminosities within the CALIFA completeness limits (285 galaxies). The black lines represent the visual classification from Walcher et al. (2014) with the upper limits including both weak (AB) and strong (B) bars and the lower limit accounting only for strong bars. Note that since the Walcher et al. (2014) Hubble type and bar identification are the average among different independent classifications, some ellipticals were classified as weakly barred. Bins with less than five galaxies are not shown.
Current usage metrics show cumulative count of Article Views (full-text article views including HTML views, PDF and ePub downloads, according to the available data) and Abstracts Views on Vision4Press platform.
Data correspond to usage on the plateform after 2015. The current usage metrics is available 48-96 hours after online publication and is updated daily on week days.
Initial download of the metrics may take a while.