Free Access
Fig. 4
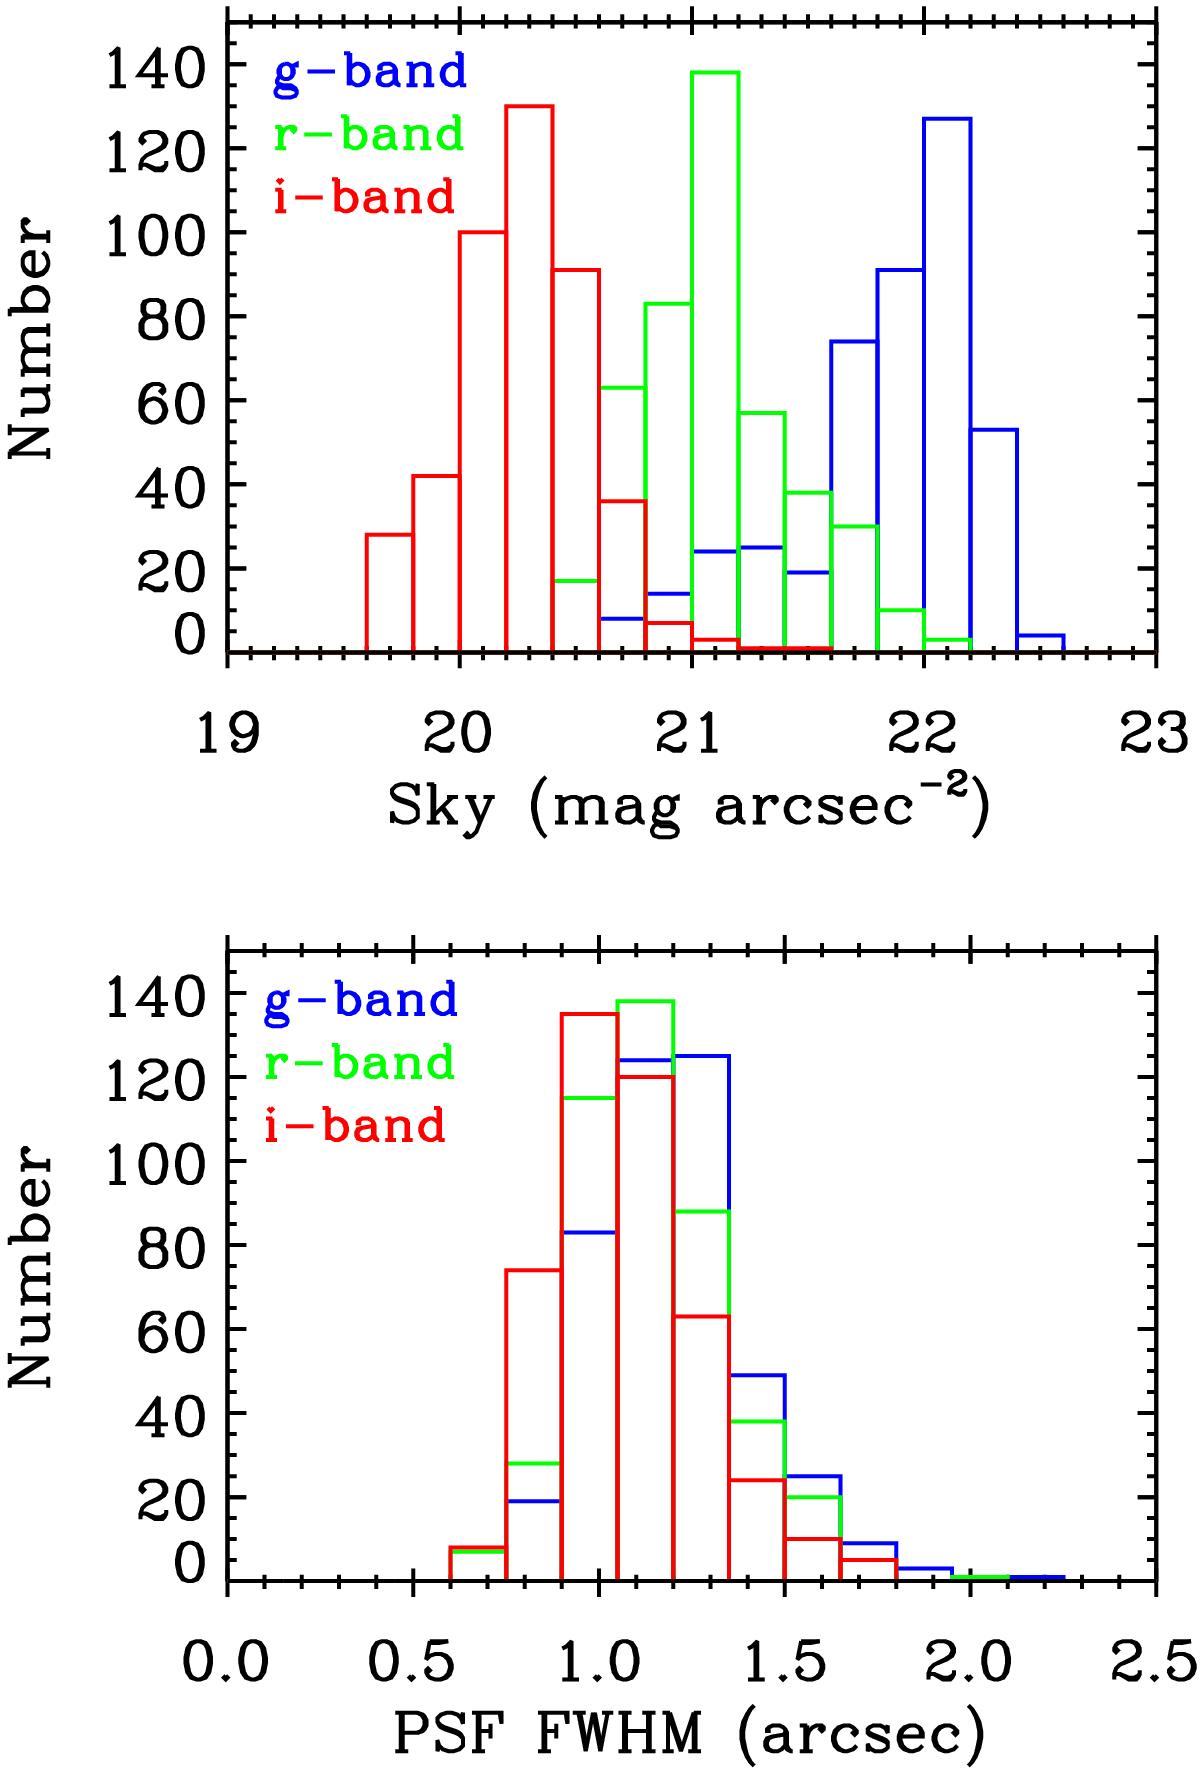
Top panel: distribution of the average surface brightness of the sky subtracted from our galaxy images. Bottom panel: distribution of the PSF FWHM in our galaxy images. In both panels the blue, green, and red histograms represent the g-, r-, and i-bands, respectively.
Current usage metrics show cumulative count of Article Views (full-text article views including HTML views, PDF and ePub downloads, according to the available data) and Abstracts Views on Vision4Press platform.
Data correspond to usage on the plateform after 2015. The current usage metrics is available 48-96 hours after online publication and is updated daily on week days.
Initial download of the metrics may take a while.