Fig. 3
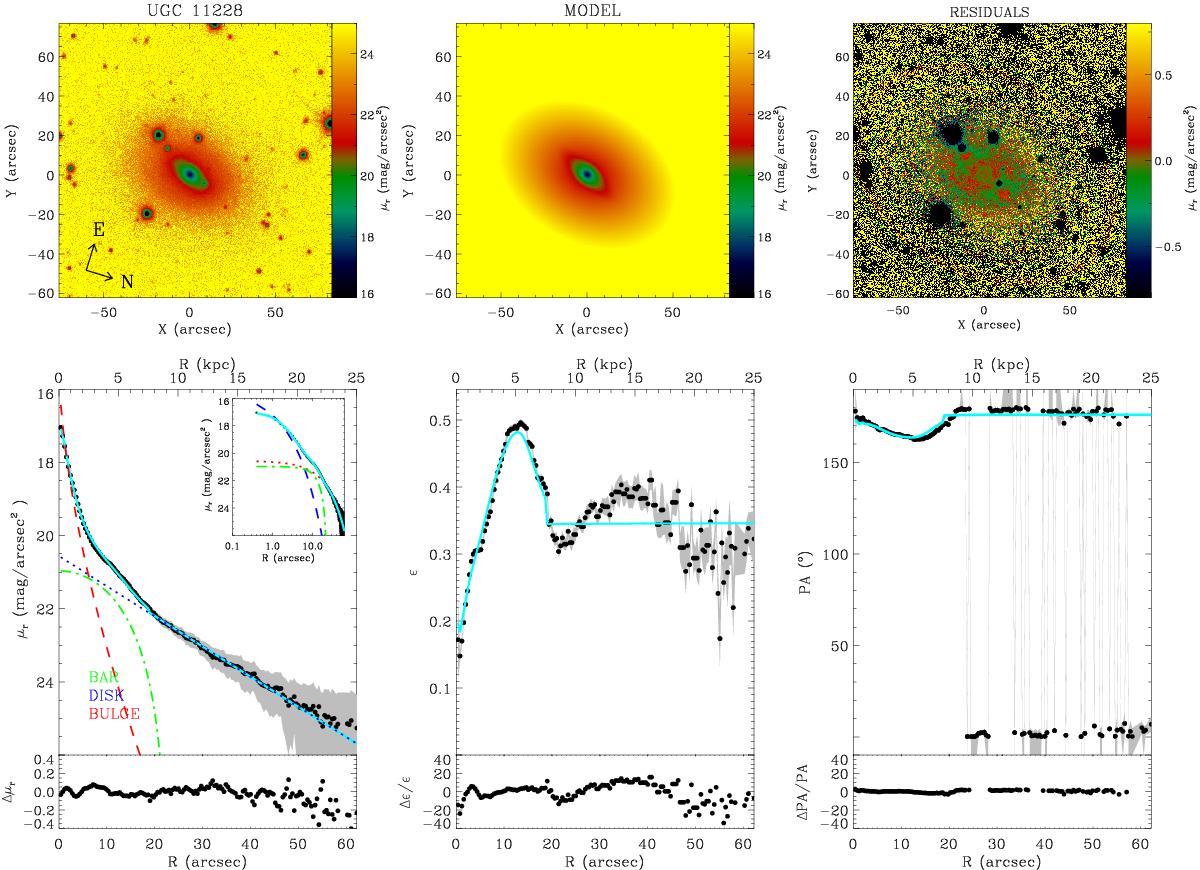
Example of a diagnostic figure used to determine the number of stellar components for each galaxy. The plot represents the best fit using three components (bulge, bar, and disc) for the r-band image of UGC 11228. Similar plots were created for the g- and i-band to check for consistency. Top left panel: galaxy image. Top middle panel: best-fitting model of the galaxy image obtained by adding a bulge, a bar, and a disc component. Top right panel: residual image obtained by subtracting the best-fit model from the galaxy image. Bottom left panel: ellipse-averaged surface brightness radial profile of the galaxy (black dots) and best-fit model (cyan solid line). The light contributions of the bulge (dashed red line), disc (dotted blue line), and bar (dotted-dashed green line) are shown. The upper inset shows a zoom of the surface-brightness data and fit with a logarithmic scale for the distance to the center of the galaxy. 1D surface brightness residuals (in mag/arcsec2 units) are shown in the bottom sub-panel. Bottom middle panel: ellipse-averaged radial profile of ellipticity of the galaxy (black dots) and best-fit model (cyan solid line). 1D residuals (in percentage) are shown in the bottom sub-panel. Bottom right panel: ellipse-averaged radial profile of position angle of the galaxy (black dots) and best-fit model (cyan solid line). 1D residuals (in percentage) are shown in the bottom sub-panel. The grey shaded areas in the bottom panels represent the measurement errors derived from the ellipse IRAF task when applied to the galaxy image.
Current usage metrics show cumulative count of Article Views (full-text article views including HTML views, PDF and ePub downloads, according to the available data) and Abstracts Views on Vision4Press platform.
Data correspond to usage on the plateform after 2015. The current usage metrics is available 48-96 hours after online publication and is updated daily on week days.
Initial download of the metrics may take a while.