Free Access
Fig. 2
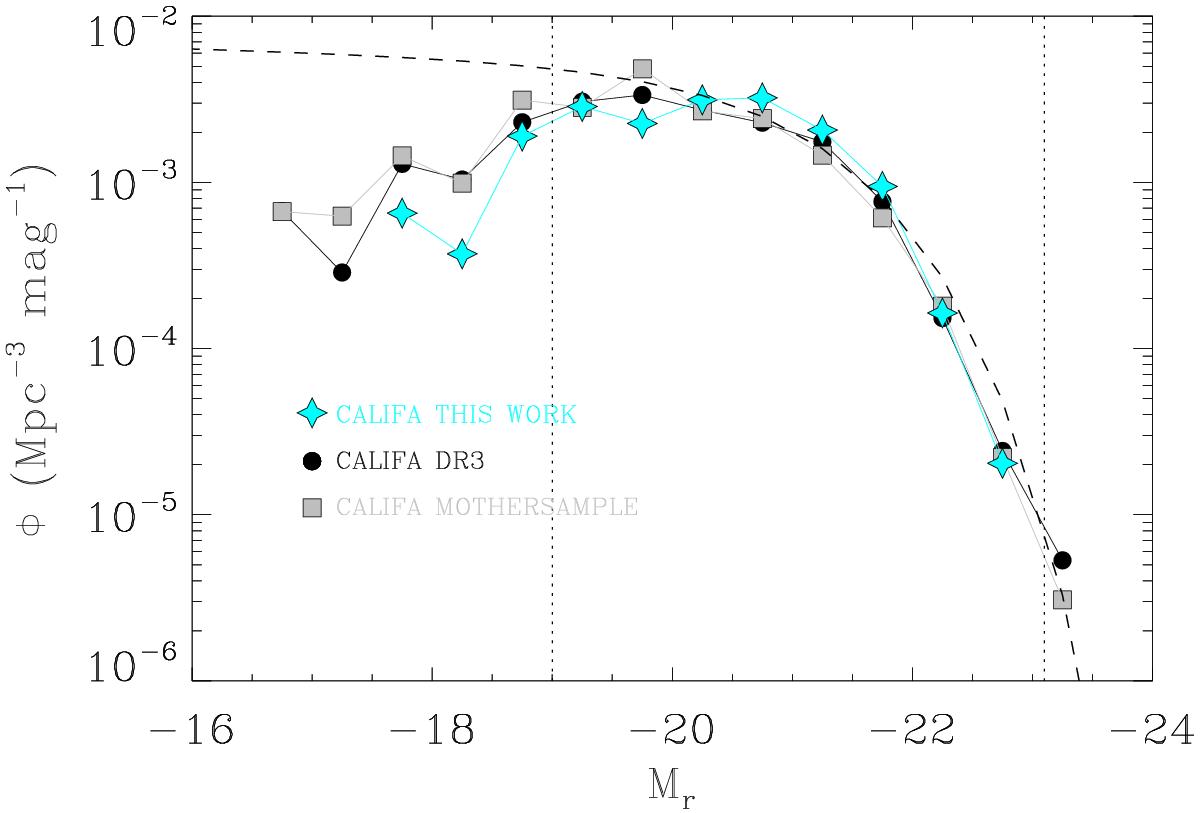
Luminosity functions of the CALIFA mother sample (grey squares), final CALIFA observed sample in the DR3 (black dots), and the sample described in this paper (cyan stars). The dotted lines denote the mother sample completeness limits. The SDSS luminosity function of Blanton et al. (2003) is shown with a black dashed line.
Current usage metrics show cumulative count of Article Views (full-text article views including HTML views, PDF and ePub downloads, according to the available data) and Abstracts Views on Vision4Press platform.
Data correspond to usage on the plateform after 2015. The current usage metrics is available 48-96 hours after online publication and is updated daily on week days.
Initial download of the metrics may take a while.