Fig. 11
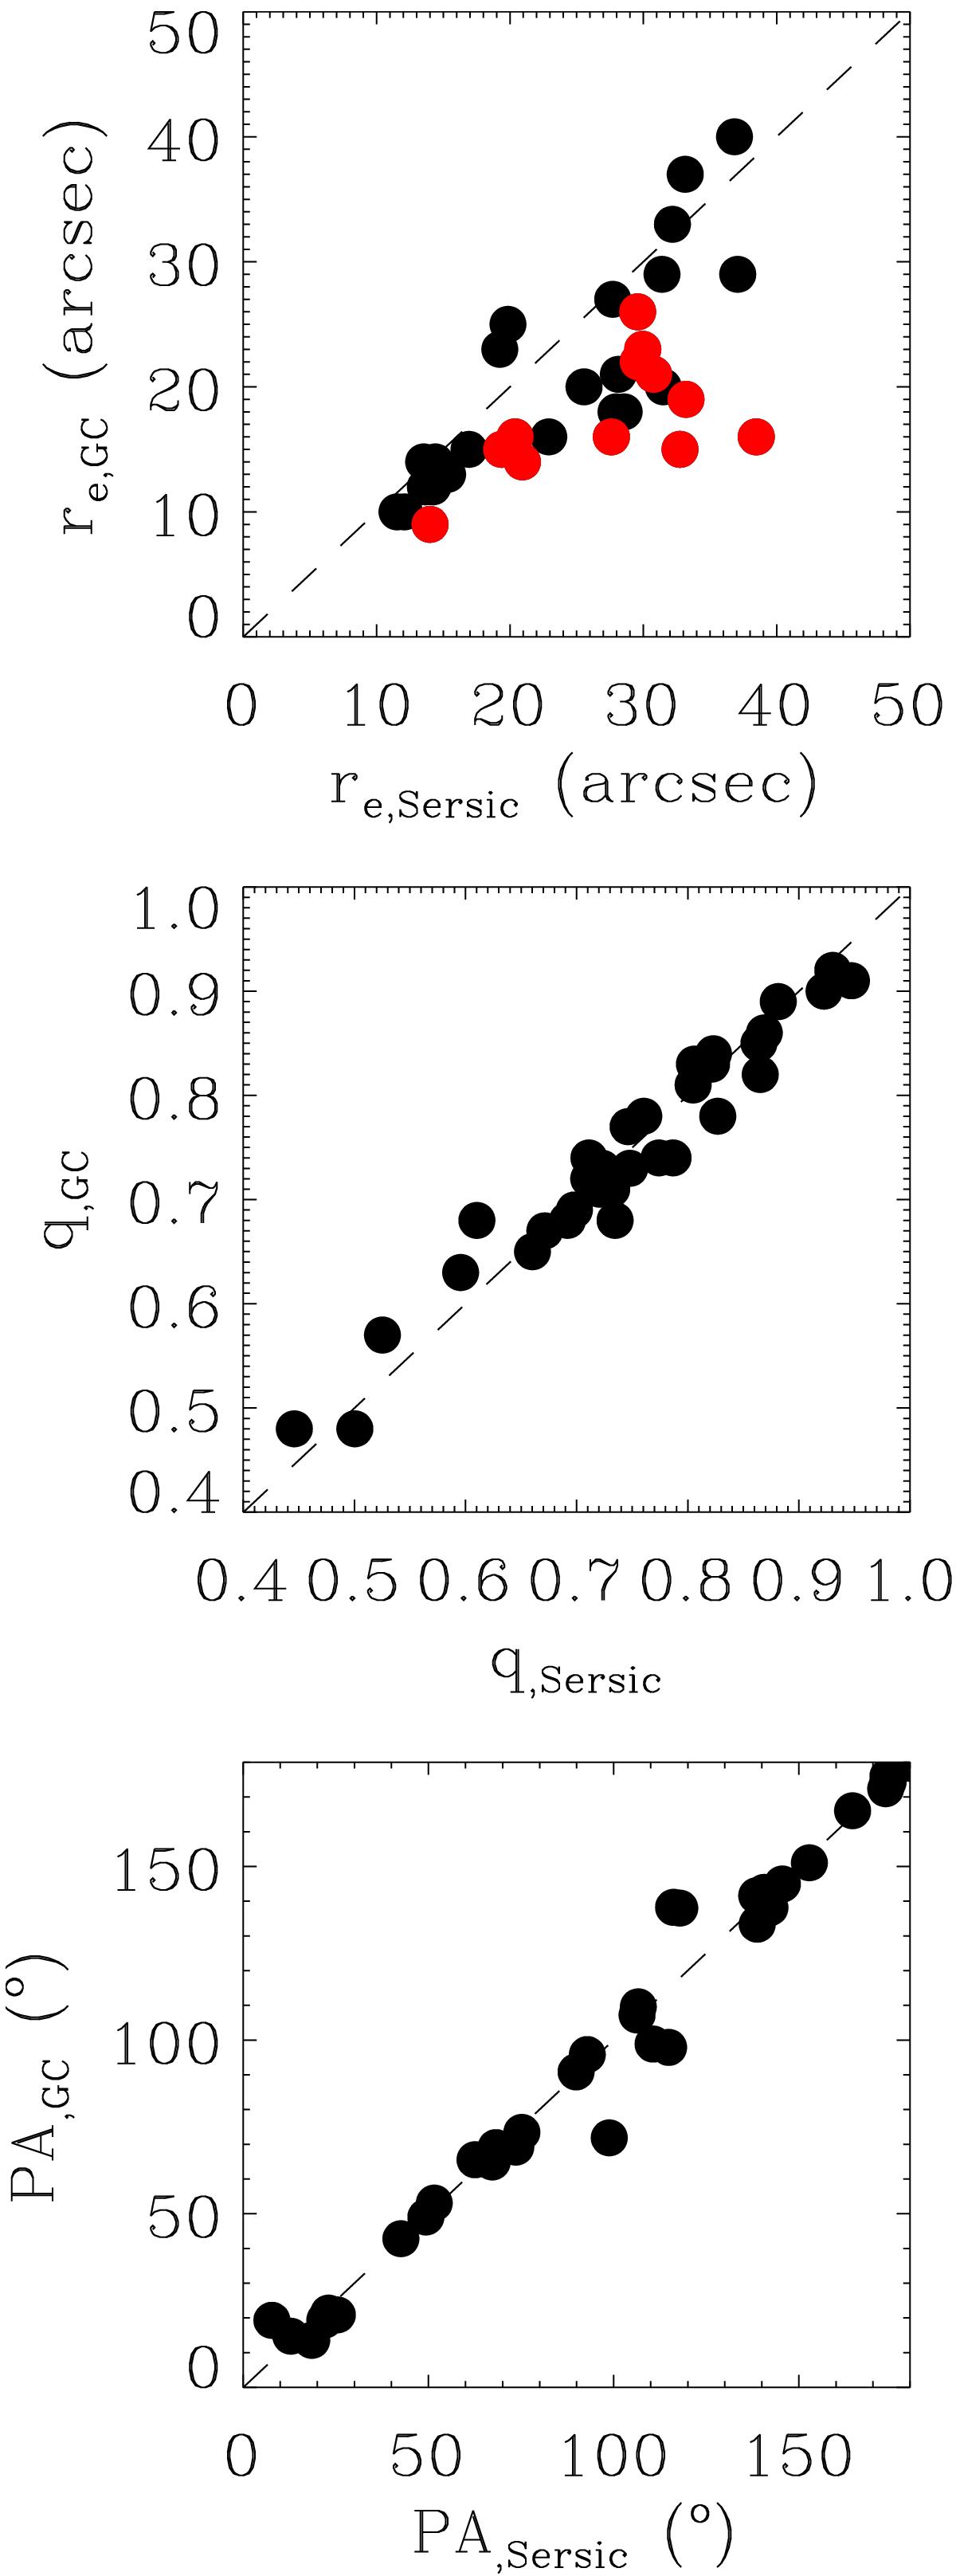
Comparison of our photometric decomposition r-band estimated parameters (labelled as Sérsic) with those obtained from the growth curves (labelled as GC) in Walcher et al. (2014). Only those galaxies fitted with a single Sérsic profile have been used in this comparison. From top to bottom, panels show the galaxy effective radius, axis ratio, and position angle, respectively. Red points in the upper panel represent galaxies fitted with a single Sérsic with n> 5.5.
Current usage metrics show cumulative count of Article Views (full-text article views including HTML views, PDF and ePub downloads, according to the available data) and Abstracts Views on Vision4Press platform.
Data correspond to usage on the plateform after 2015. The current usage metrics is available 48-96 hours after online publication and is updated daily on week days.
Initial download of the metrics may take a while.