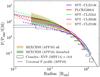
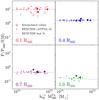
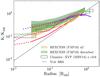
Fig. 9
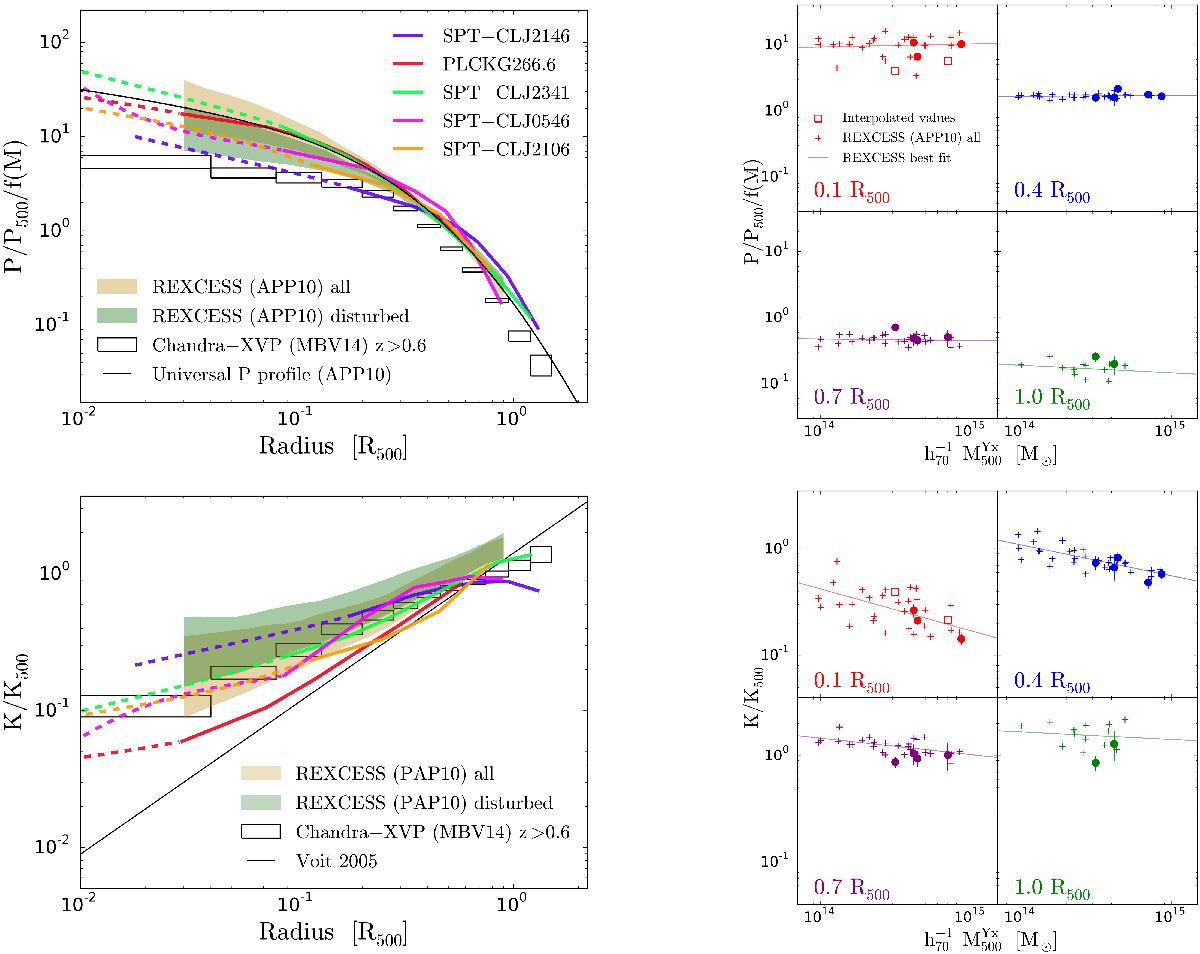
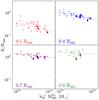
Top left: dimensionless pressure profiles scaled by P500 and f(M), colour-coded as in the bottom right panel of Fig. 3. The 1σ dispersion in the REXCESS pressure profiles (Arnaud et al. 2010, APP10) considering the full sample and the disturbed susbset are plotted using the same colour-code as in the left panel of Fig. 7. The black solid line is the universal pressure profile from Arnaud et al. (2010). Black boxes show the stacked pressure profile of McDonald et al. (2014, MBV14) and its uncertainty. Top right: scaled pressure values computed at fixed radii as a function of M500 of our sample (points) and REXCESS (crosses). The black solid line shows the best power-law fit to the REXCESS sample. To avoid confusion, the REXCESS errors are not plotted. Bottom left and right: same but for the entropy profiles, scaled by K500 from Pratt et al. (2010, PAP10). The black solid line shows the theoretical entropy profiles from the gravity-only simulations of Voit et al. (2005).
Current usage metrics show cumulative count of Article Views (full-text article views including HTML views, PDF and ePub downloads, according to the available data) and Abstracts Views on Vision4Press platform.
Data correspond to usage on the plateform after 2015. The current usage metrics is available 48-96 hours after online publication and is updated daily on week days.
Initial download of the metrics may take a while.