Fig. 8
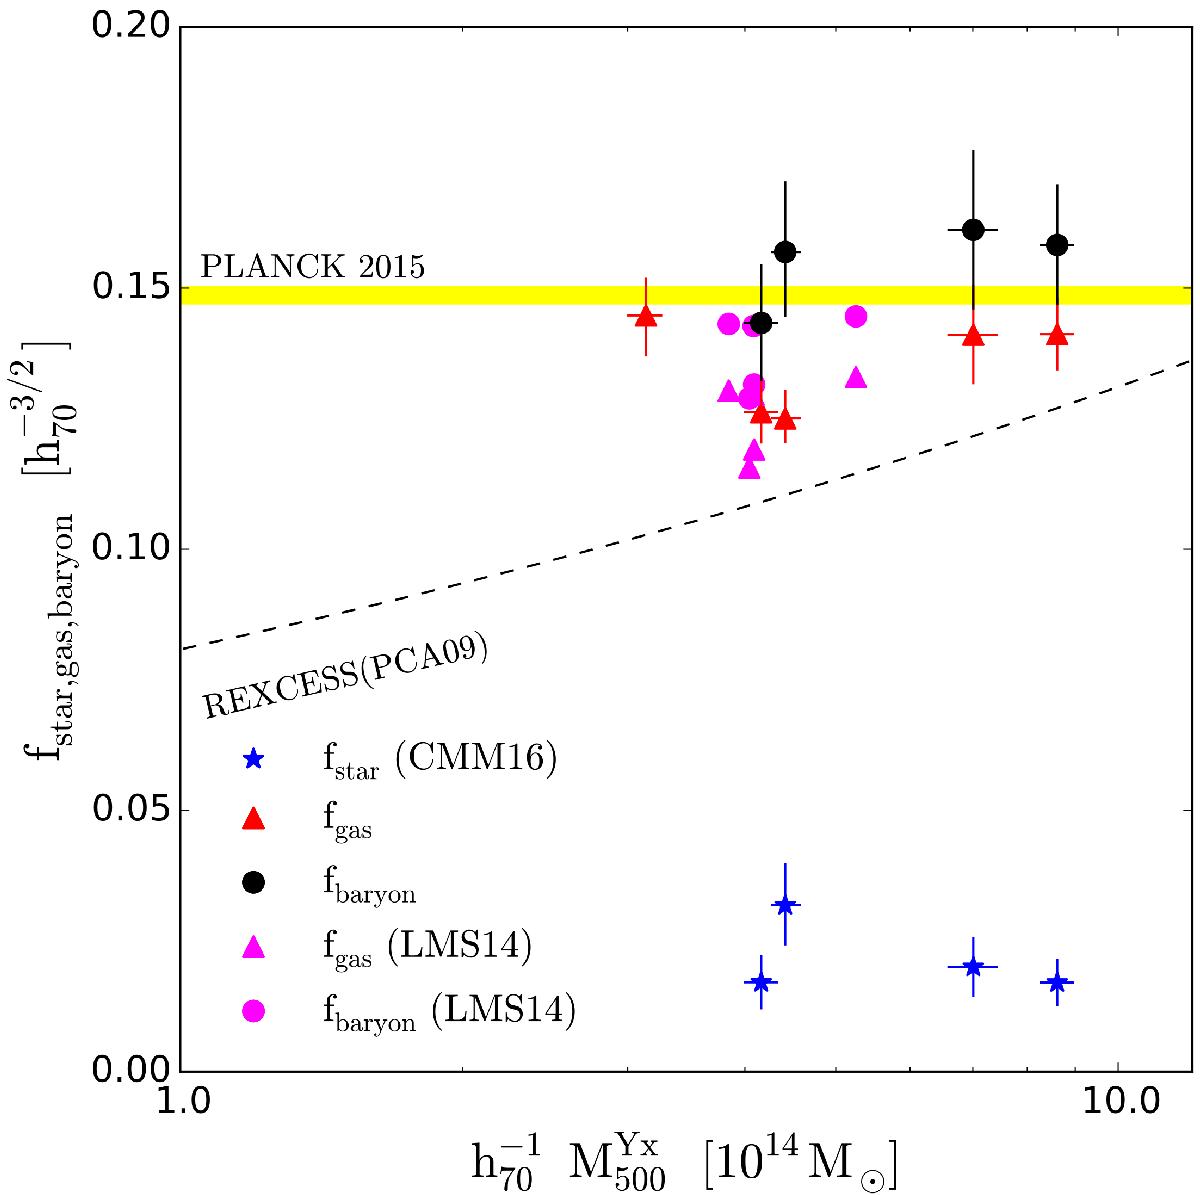
Fraction of mass in stars, gas and total baryons at R500. Blue stars and red triangles represent the stellar mass fraction (Chiu et al. 2016, CMM16) and the gas-mass fraction at R500, respectively. The black points represent the sum of the two (i.e. the total baryon mass). For SPT-CLJ2 146-4632 there are no stellar mass fraction measures available. Magenta points show the gas and total baryon fraction of five clusters with M500> 4.5 × 10¹⁴M⊙ from the cosmo-OWLs simulations (Le Brun et al. 2014, LMS14). The yellow area is the baryon fraction as measured from Planck Collaboration XIII (2016). The dashed black line is the variation of gas-mass fraction with mass in the REXCESS sample (Pratt et al. 2009, PCA09).
Current usage metrics show cumulative count of Article Views (full-text article views including HTML views, PDF and ePub downloads, according to the available data) and Abstracts Views on Vision4Press platform.
Data correspond to usage on the plateform after 2015. The current usage metrics is available 48-96 hours after online publication and is updated daily on week days.
Initial download of the metrics may take a while.