Fig. 7
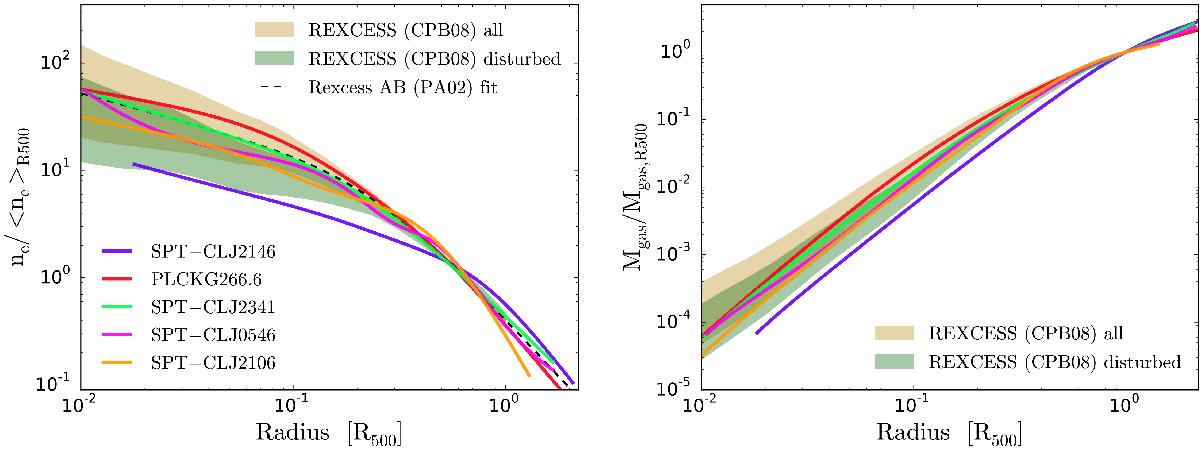
Left panel: density profiles scaled by the integrated density within R500. Gold and green shaded areas are the scatter computed from REXCESS density profiles (Croston et al. 2008, CPB08) using the full sample and only the disturbed objects (Pratt et al. 2009), respectively. The dashed line is the fit of the average REXCESS density profile with an AB model (Pratt & Arnaud 2002, PA02). The profile colour-coding is the same as in the bottom right panel of Fig. 3. Right panel: gas mass profiles scaled to the average gas mass within R500. The colour-code is same as in the left panel.
Current usage metrics show cumulative count of Article Views (full-text article views including HTML views, PDF and ePub downloads, according to the available data) and Abstracts Views on Vision4Press platform.
Data correspond to usage on the plateform after 2015. The current usage metrics is available 48-96 hours after online publication and is updated daily on week days.
Initial download of the metrics may take a while.