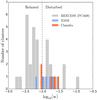
Fig. 6
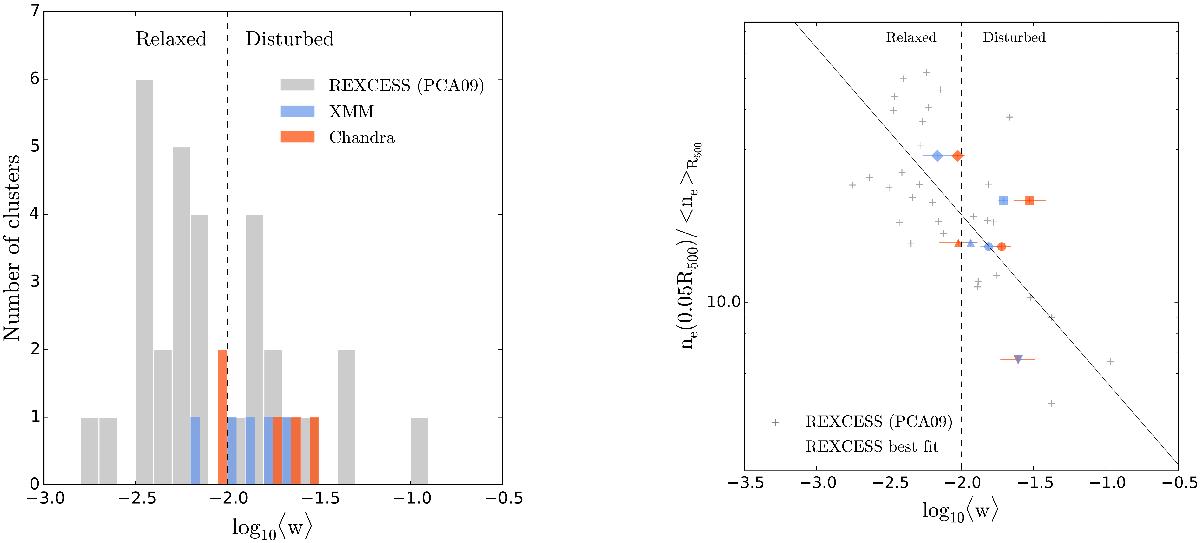
Left panel: number of clusters as a function of ⟨ w ⟩ for the REXCESS sample (Pratt et al. 2009, PCA09) are plotted in grey. Our objects are plotted in blue and red for XMM-Newton and Chandra, respectively. The dashed line separates morphologically disturbed clusters from the rest. We plot XMM-Newton and Chandra lines using a binsize of 0.05 for clarity reasons, whereas for the histogram computation we use a binsize of 0.1. Right panel: distribution of the scaled density computed at 0.05 R500 as a function of ⟨ w ⟩. Grey crosses show the REXCESS sample, while blue and red points represent XMM-Newton and Chandra measurements, respectively, of our sample. The black solid line is the best-fit of the REXCESS sample.
Current usage metrics show cumulative count of Article Views (full-text article views including HTML views, PDF and ePub downloads, according to the available data) and Abstracts Views on Vision4Press platform.
Data correspond to usage on the plateform after 2015. The current usage metrics is available 48-96 hours after online publication and is updated daily on week days.
Initial download of the metrics may take a while.