Fig. 5
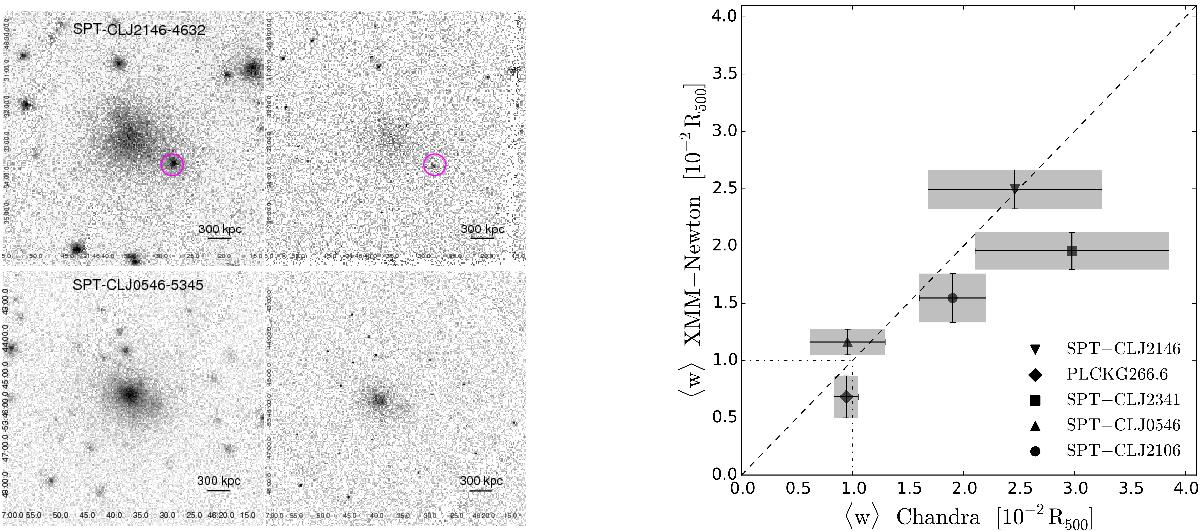
Left panel: XMM-Newton (left) and Chandra (right) images of SPT-CLJ 2146-4632 (top) and SPT-CLJ 0546-5345 (bottom) in the [0.3−2] keV band. The images pixel size is 2″, and for ease of comparison, the same scale is used for all. The magenta circle identifies the point source that contaminates the substructure emission in the XMM-Newton image of SPT-CLJ 2146-4632. Right panel: centroid shift parameter, ⟨ w ⟩, values computed using Chandra and XMM-Newton in units of 10-2R500. The dashed line is the identity relation. The two dot-dashed lines define the region where the clusters are considered to be dynamically relaxed (see text).
Current usage metrics show cumulative count of Article Views (full-text article views including HTML views, PDF and ePub downloads, according to the available data) and Abstracts Views on Vision4Press platform.
Data correspond to usage on the plateform after 2015. The current usage metrics is available 48-96 hours after online publication and is updated daily on week days.
Initial download of the metrics may take a while.