Fig. 3
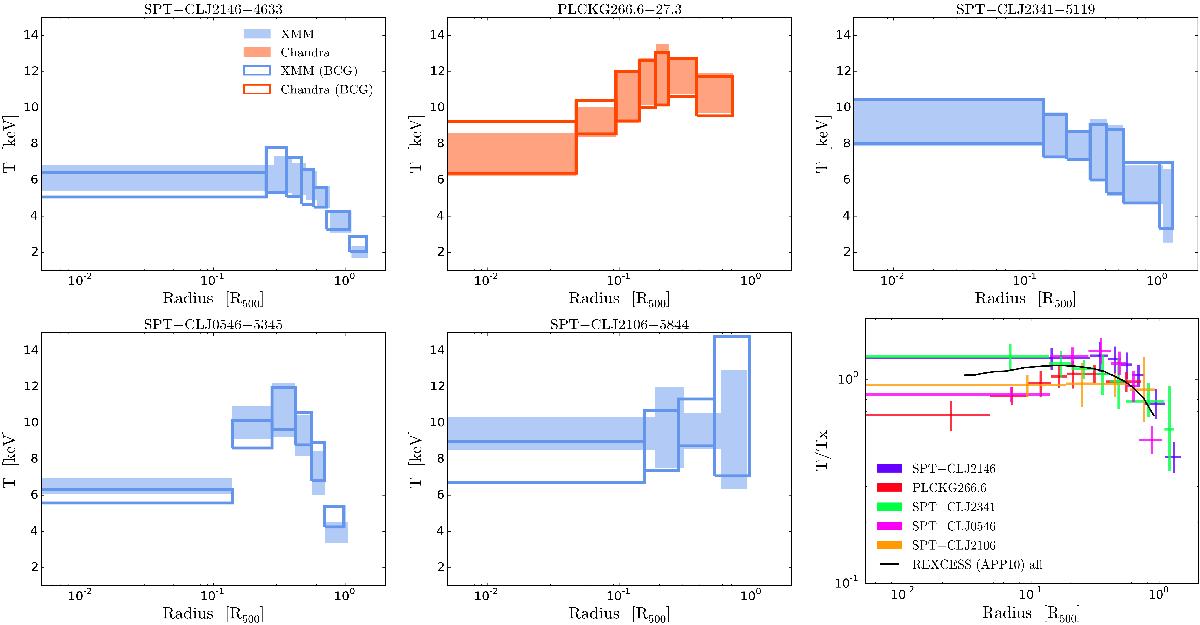
First five panels: 3D temperature profiles. Blue and orange rectangles are profiles determined using XMM-Newton and Chandra datasets, respectively. Filled and empty boxes represent profiles computed using the X-ray peak and the BCG as centre, respectively. Bottom right panel: 3D X-ray peak-centred temperature profiles scaled to their global TX values. The solid black line shows the average value of the REXCESS temperature profiles (Pratt et al. 2007; Arnaud et al. 2010, APP10). Profiles are colour coded according to the mass estimated from M500,YX, the most massive being red and least massive being blue.
Current usage metrics show cumulative count of Article Views (full-text article views including HTML views, PDF and ePub downloads, according to the available data) and Abstracts Views on Vision4Press platform.
Data correspond to usage on the plateform after 2015. The current usage metrics is available 48-96 hours after online publication and is updated daily on week days.
Initial download of the metrics may take a while.