Fig. 2
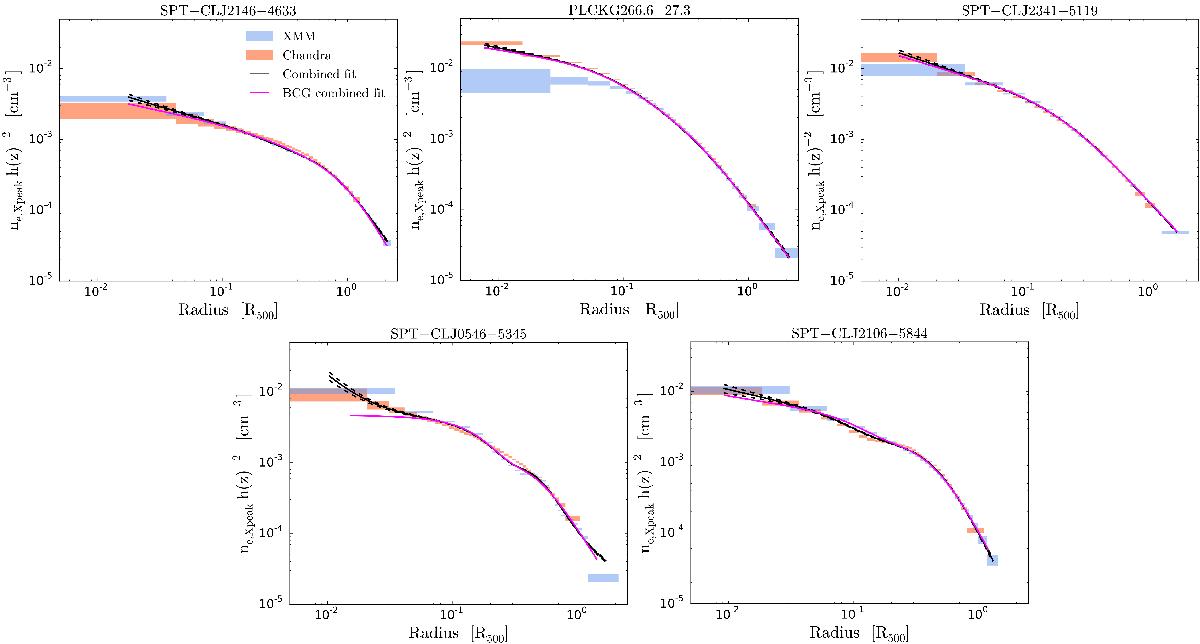
Normalised, scaled, deprojected, density profiles centred on the X-ray peak. Blue and orange rectangles represent XMM-Newton and Chandra datasets, respectively. The solid black line shows the combined density profile resulting from the simultaneous fit to the XMM-Newton and Chandra data, as discussed in the text. Its uncertainties are shown with the dashed line. The magenta line shows the simultaneous fit for the profiles centred on the BCG.
Current usage metrics show cumulative count of Article Views (full-text article views including HTML views, PDF and ePub downloads, according to the available data) and Abstracts Views on Vision4Press platform.
Data correspond to usage on the plateform after 2015. The current usage metrics is available 48-96 hours after online publication and is updated daily on week days.
Initial download of the metrics may take a while.