Fig. A.1
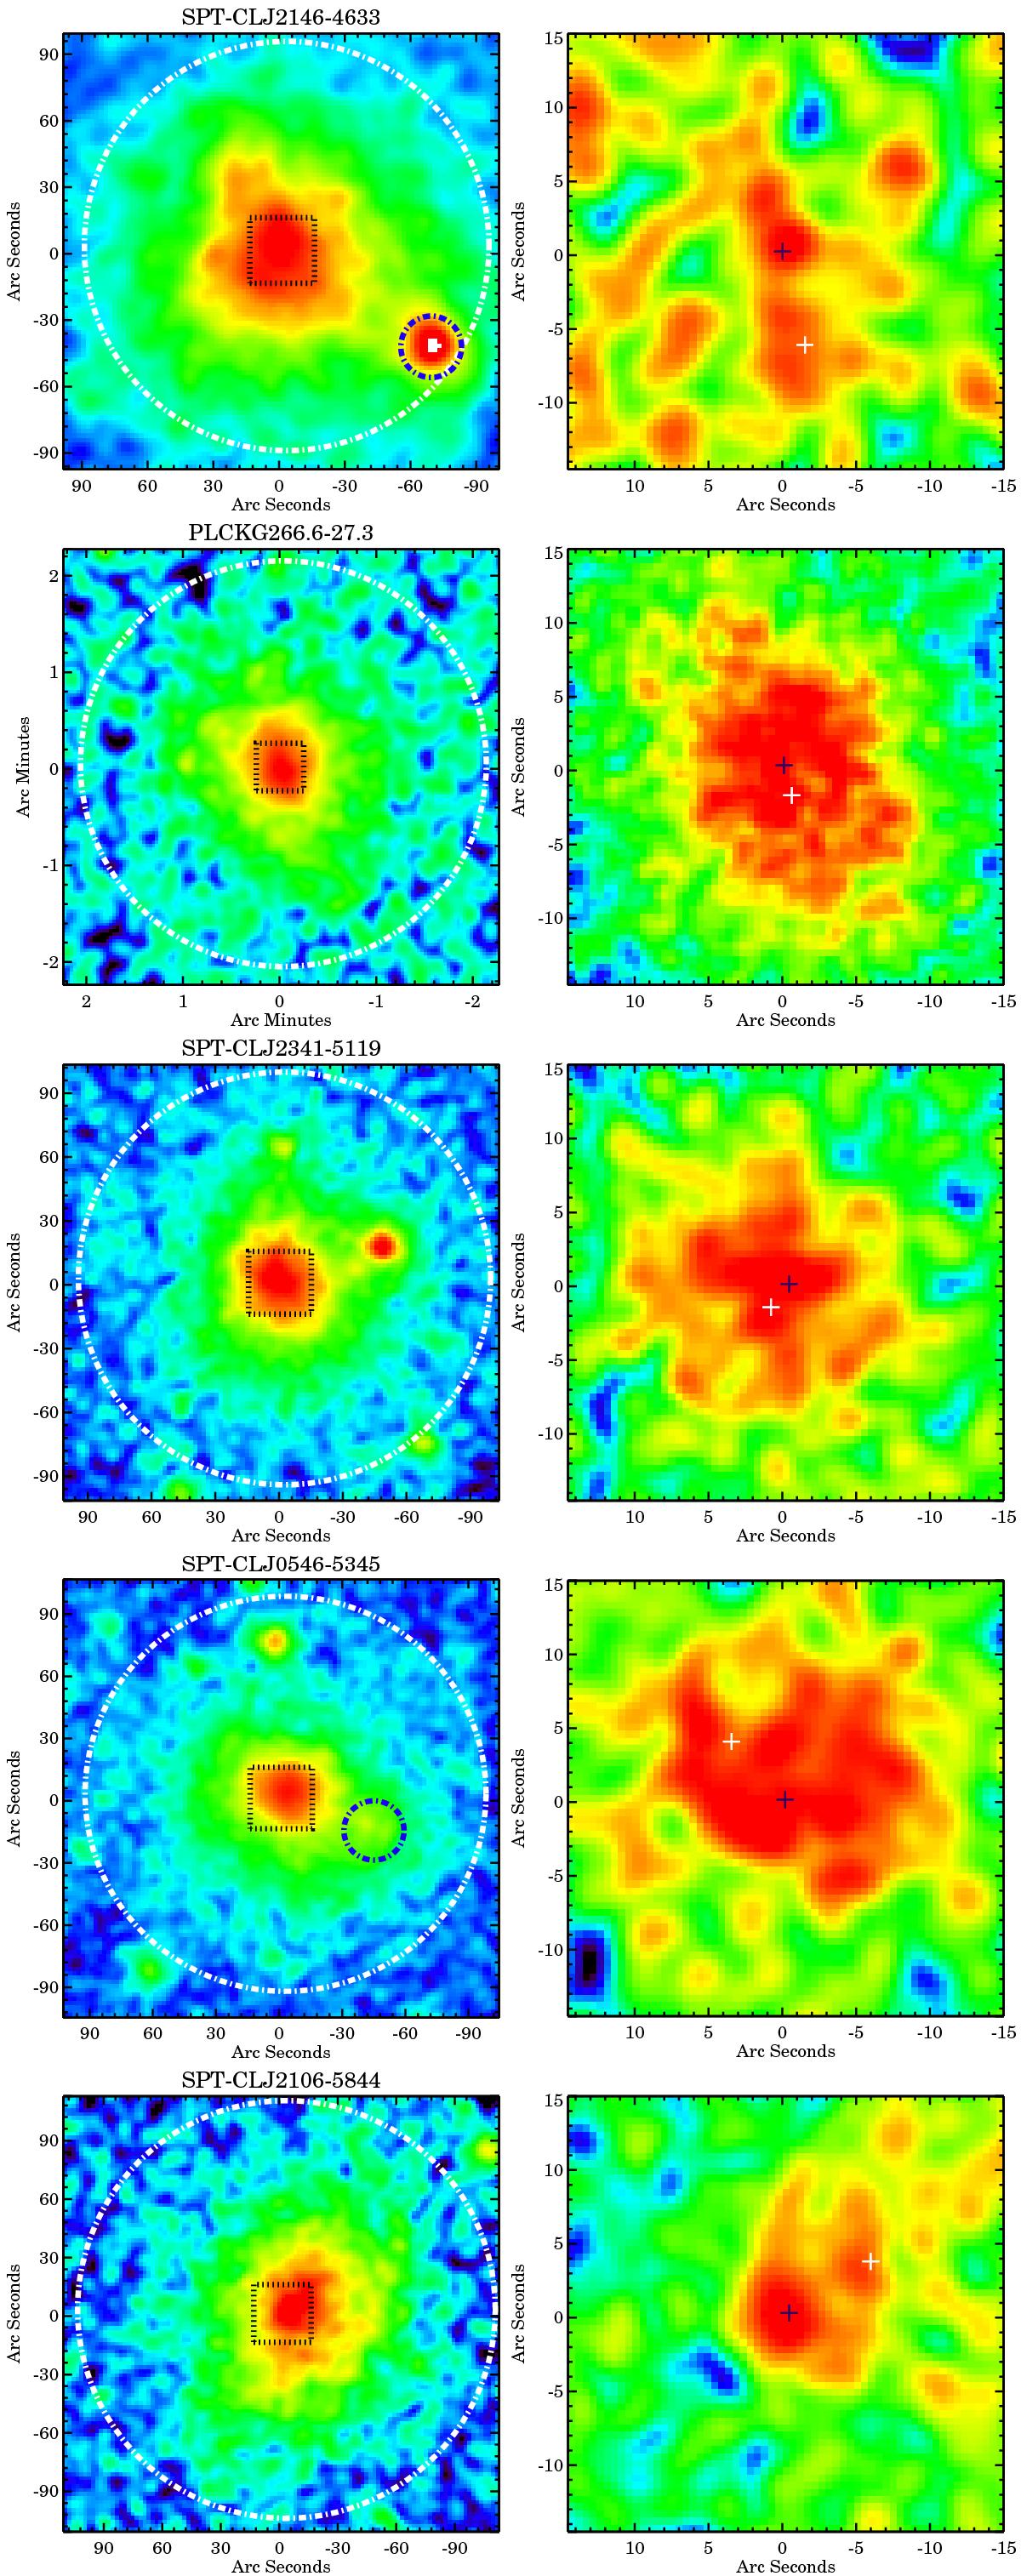
Left column: XMM-Newton images in the [0.3−2] keV band. Each image is smoothed to enhance the emission on large scale. The white dotted circle represents R500 and the black dotted box represents the field of view of the Chandra image on the right column. The blue dotted circle in the SPT-CLJ 2146-4632 and SPT-CLJ 0546-5345 images highlights the substructures. Right column: Chandra images in the [0.5−2.5] keV band. Black and white crosses identify the X-ray peak and the BCG position, respectively.
Current usage metrics show cumulative count of Article Views (full-text article views including HTML views, PDF and ePub downloads, according to the available data) and Abstracts Views on Vision4Press platform.
Data correspond to usage on the plateform after 2015. The current usage metrics is available 48-96 hours after online publication and is updated daily on week days.
Initial download of the metrics may take a while.