Free Access
Fig. 10
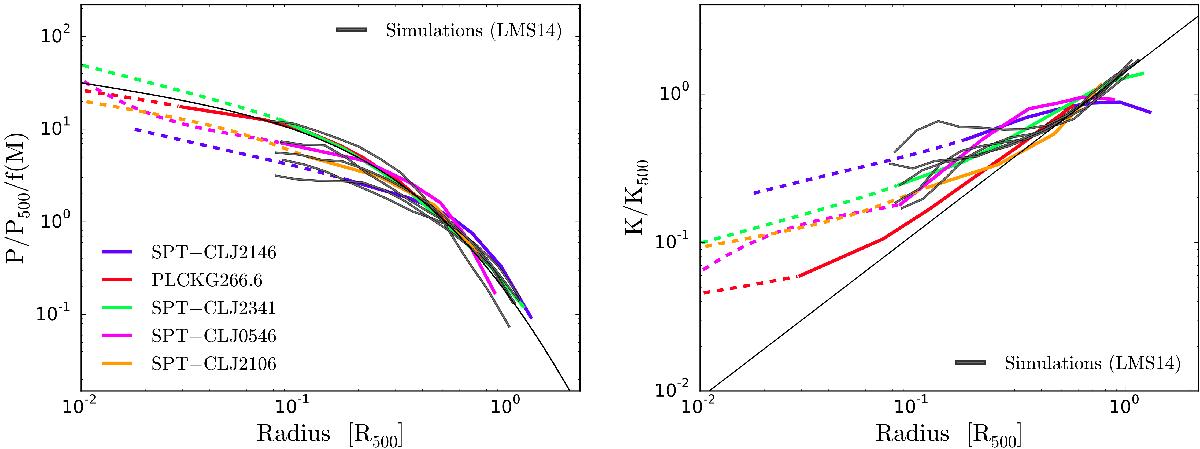
Left panel: scaled pressure profiles, shown using the same legend as in top left panel of Fig. 9. Grey-black lines are the profiles extracted from the simulated clusters of Le Brun et al. (2014, LMS14). Right panel: same as left except for the fact that we show entropy profiles.
This figure is made of several images, please see below:
Current usage metrics show cumulative count of Article Views (full-text article views including HTML views, PDF and ePub downloads, according to the available data) and Abstracts Views on Vision4Press platform.
Data correspond to usage on the plateform after 2015. The current usage metrics is available 48-96 hours after online publication and is updated daily on week days.
Initial download of the metrics may take a while.