Fig. 20
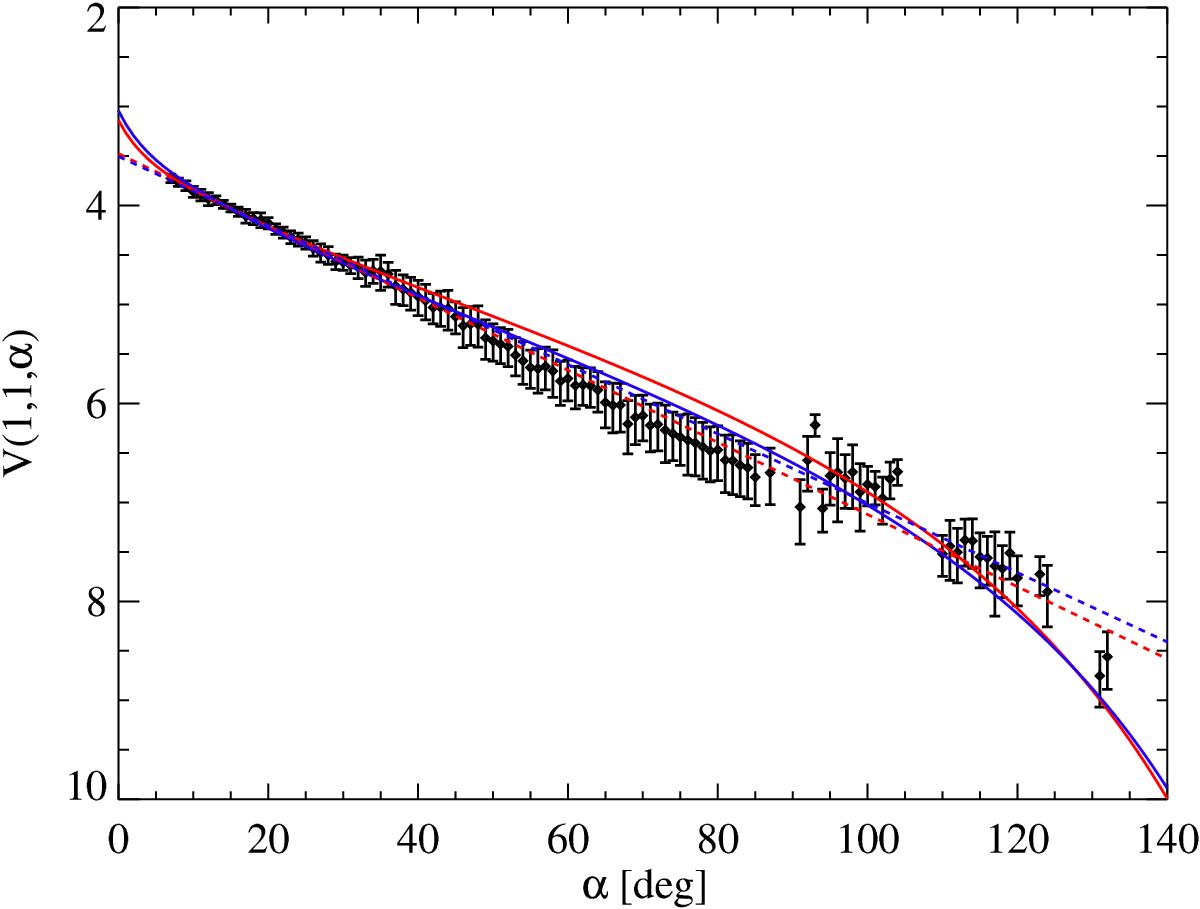
Ceres’ magnitude phase curve V(1,1,α) as derived from VIR disk-resolved observations (diamonds). Error bars are derived from the standard deviation of the spectrally integrated I/F in each phase angle bin. Red curves are derived by fitting the dataset with the H-G formalism (solid line) and linear model (dashed line) for α ≤ 30°. Blue curves are obtained by fitting the whole phase angle interval.
Current usage metrics show cumulative count of Article Views (full-text article views including HTML views, PDF and ePub downloads, according to the available data) and Abstracts Views on Vision4Press platform.
Data correspond to usage on the plateform after 2015. The current usage metrics is available 48-96 hours after online publication and is updated daily on week days.
Initial download of the metrics may take a while.