Free Access
Fig. 10
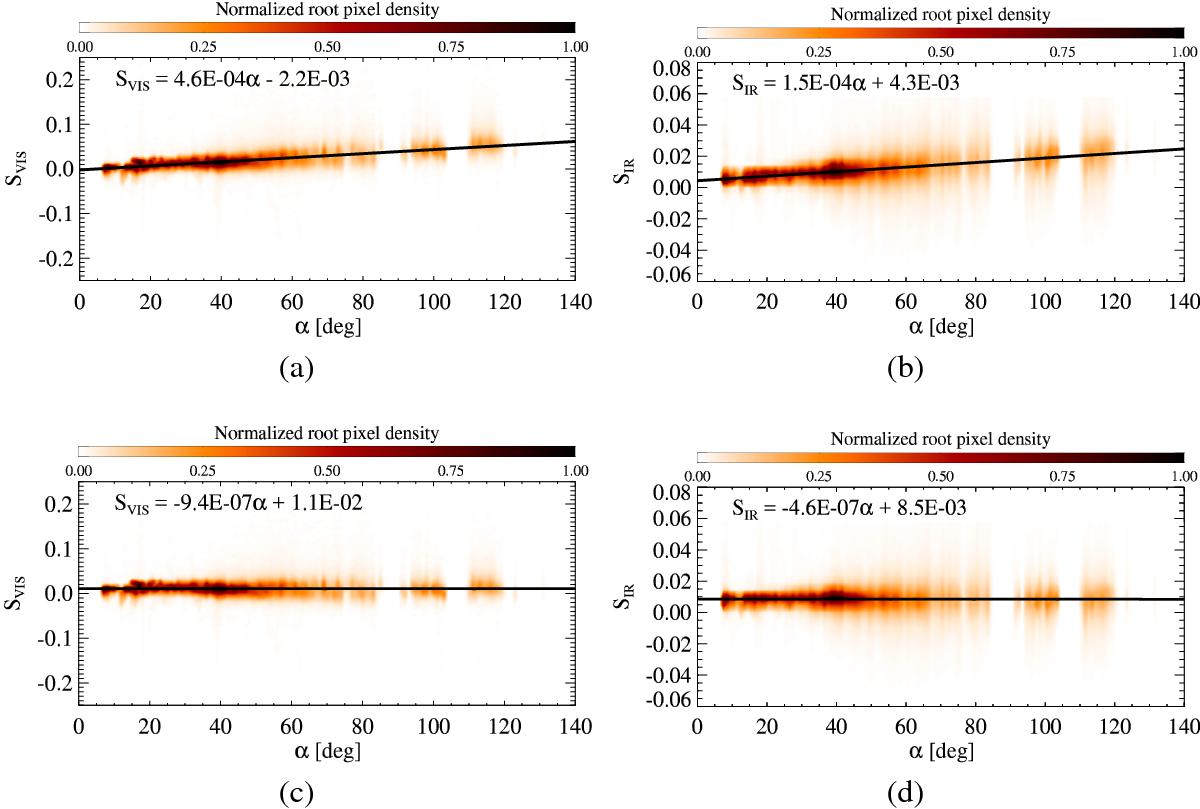
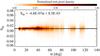
Density plot of SVISa) and SIRb) as a function of α. The same quantities after photometric correction are reported in panels c) and d). Linear fits to the distributions are reported as black solid lines in the plots, with their equations: the angular coefficient is expressed in [kÅ-1 deg-1] and intercept in [kÅ-1].
This figure is made of several images, please see below:
Current usage metrics show cumulative count of Article Views (full-text article views including HTML views, PDF and ePub downloads, according to the available data) and Abstracts Views on Vision4Press platform.
Data correspond to usage on the plateform after 2015. The current usage metrics is available 48-96 hours after online publication and is updated daily on week days.
Initial download of the metrics may take a while.