Fig. 7
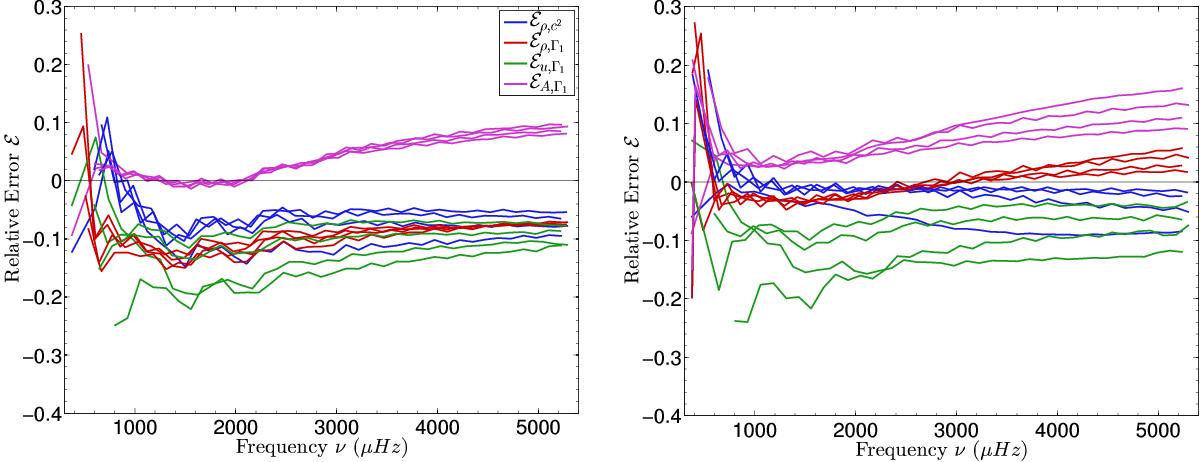
Effect of extra mixing on the verification of linear structural relations for both models. The left panel is associated with a model with a slightly inhibited extra-mixing intensity, whereas the right panel has a nearly constant extra-mixing throughout the model layers, but with an even smaller intensity. Each curve corresponds to a given ℓ of the modes.
Current usage metrics show cumulative count of Article Views (full-text article views including HTML views, PDF and ePub downloads, according to the available data) and Abstracts Views on Vision4Press platform.
Data correspond to usage on the plateform after 2015. The current usage metrics is available 48-96 hours after online publication and is updated daily on week days.
Initial download of the metrics may take a while.