Free Access
Fig. 9
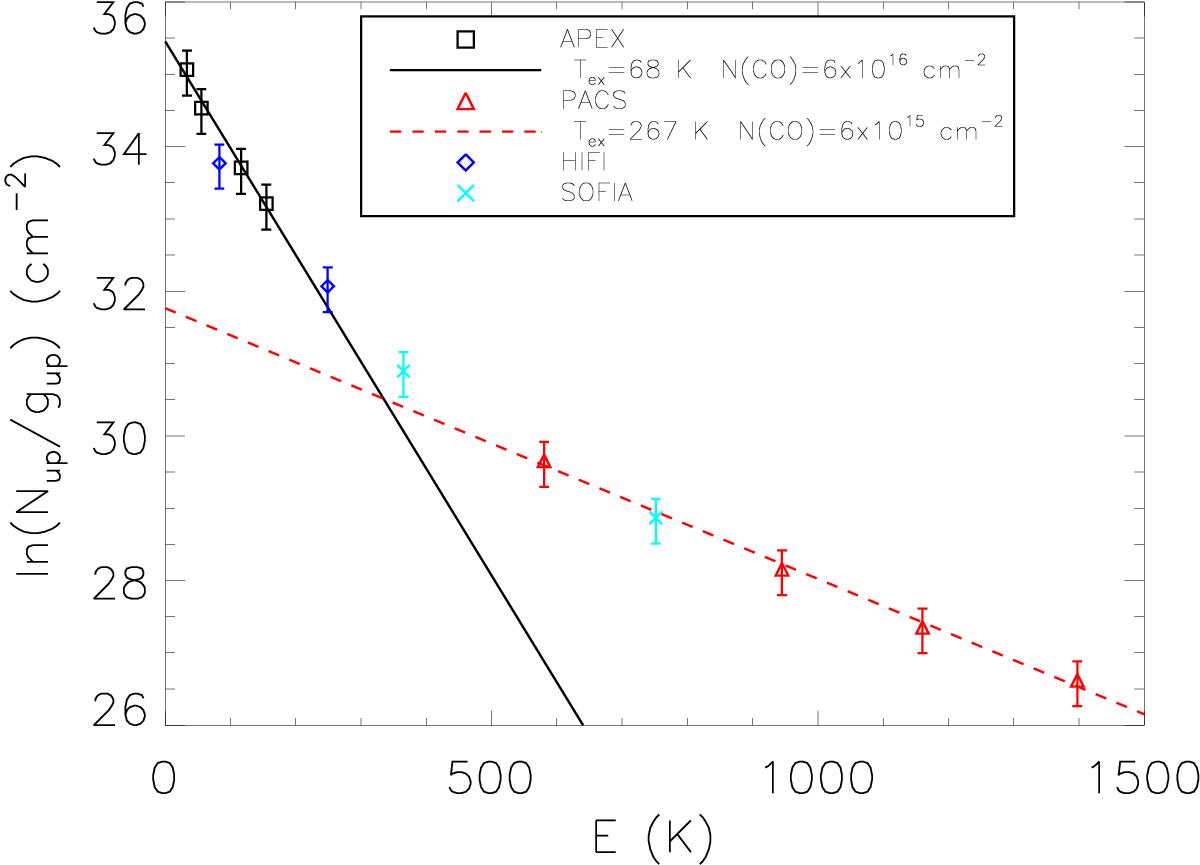
Rotational diagram of CO lines in knot A. For the low Jup lines the derived rotational temperature and column density are values averaged in the 24′′ beam, assuming a filling factor 1. For the high Jup lines a size of 18′′ is assumed.
Current usage metrics show cumulative count of Article Views (full-text article views including HTML views, PDF and ePub downloads, according to the available data) and Abstracts Views on Vision4Press platform.
Data correspond to usage on the plateform after 2015. The current usage metrics is available 48-96 hours after online publication and is updated daily on week days.
Initial download of the metrics may take a while.