Free Access
Fig. 7
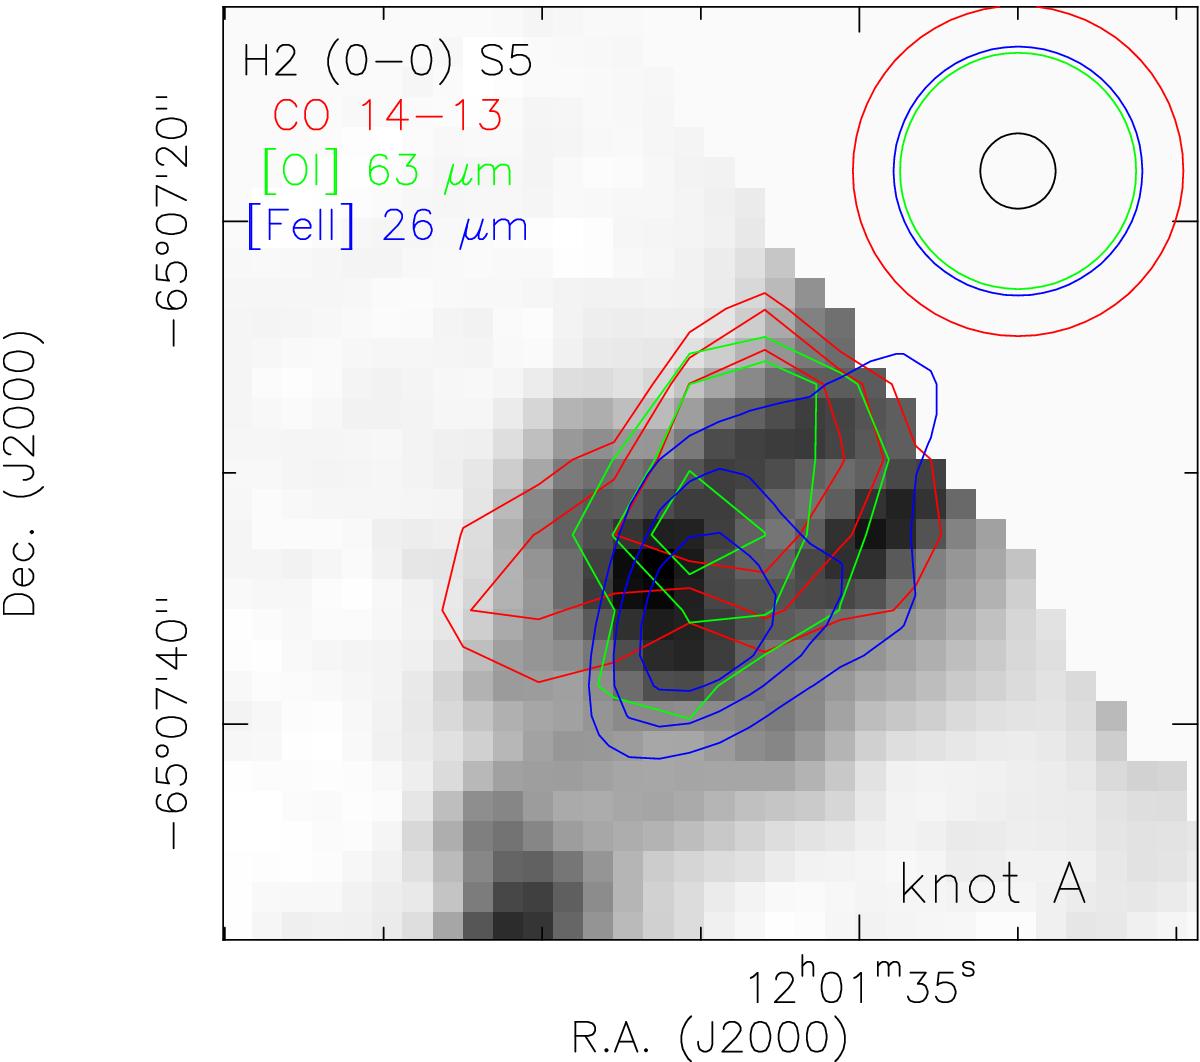
Map of the H2 0-0 S(5) line compared with CO (14–13) (red line), [O i] 63 μm (green line), [Fe ii] 26 μm (blue line) towards knot A. Contour levels is 70%, 80% and 90% of the local maxima of each line. The circles show the HPBW of the different lines.
Current usage metrics show cumulative count of Article Views (full-text article views including HTML views, PDF and ePub downloads, according to the available data) and Abstracts Views on Vision4Press platform.
Data correspond to usage on the plateform after 2015. The current usage metrics is available 48-96 hours after online publication and is updated daily on week days.
Initial download of the metrics may take a while.