Free Access
Fig. 5
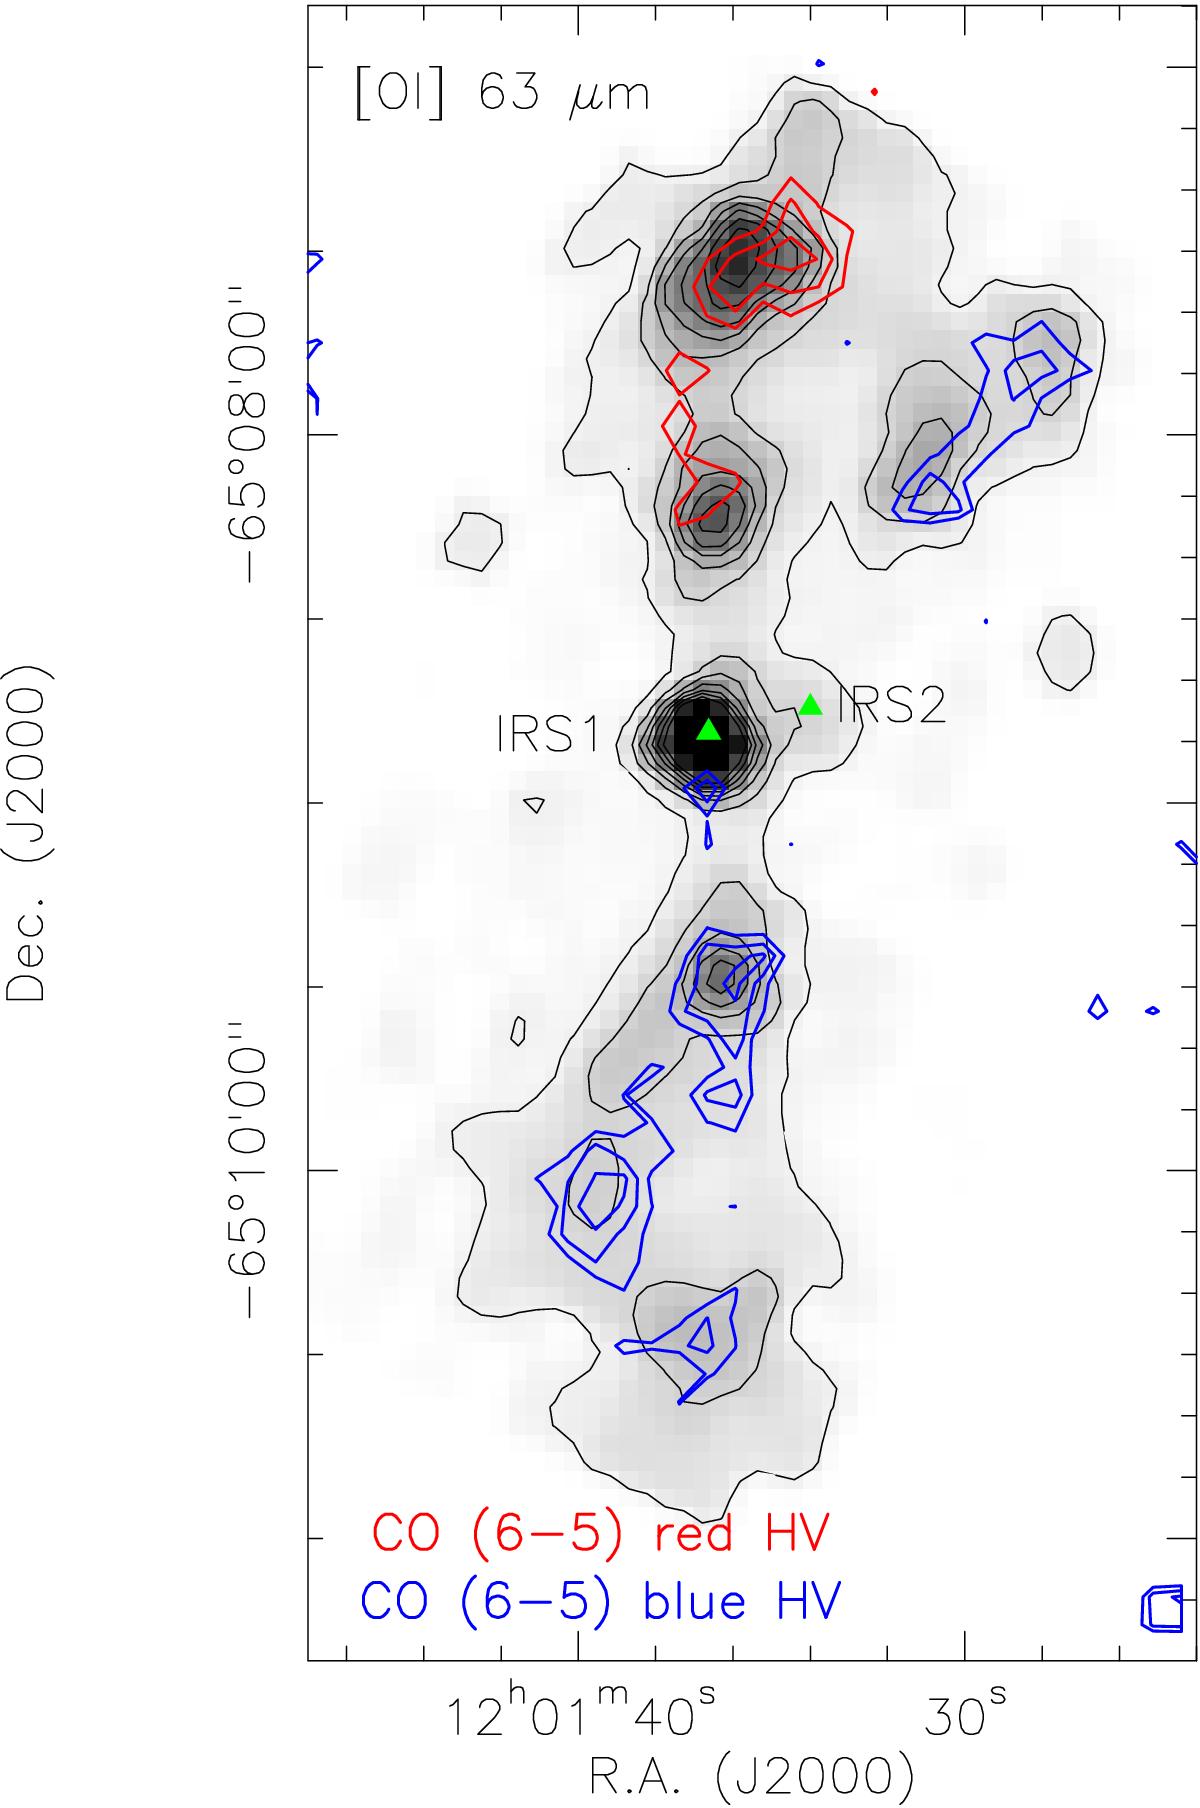
Map of the high velocity wings of CO (6–5) overlaid to [O i] 63 μm. The red wing (red line) is integrated from 10.5 km s-1 to 40 km s-1 and the blue wing (blue line) from –30 km s-1 to –19.5 km s-1. CO levels are at 50%, 70% and 90% of the maximum. The position of the two protostars are indicated with a triangle.
Current usage metrics show cumulative count of Article Views (full-text article views including HTML views, PDF and ePub downloads, according to the available data) and Abstracts Views on Vision4Press platform.
Data correspond to usage on the plateform after 2015. The current usage metrics is available 48-96 hours after online publication and is updated daily on week days.
Initial download of the metrics may take a while.