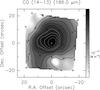
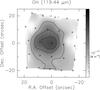
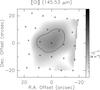
Fig. 4
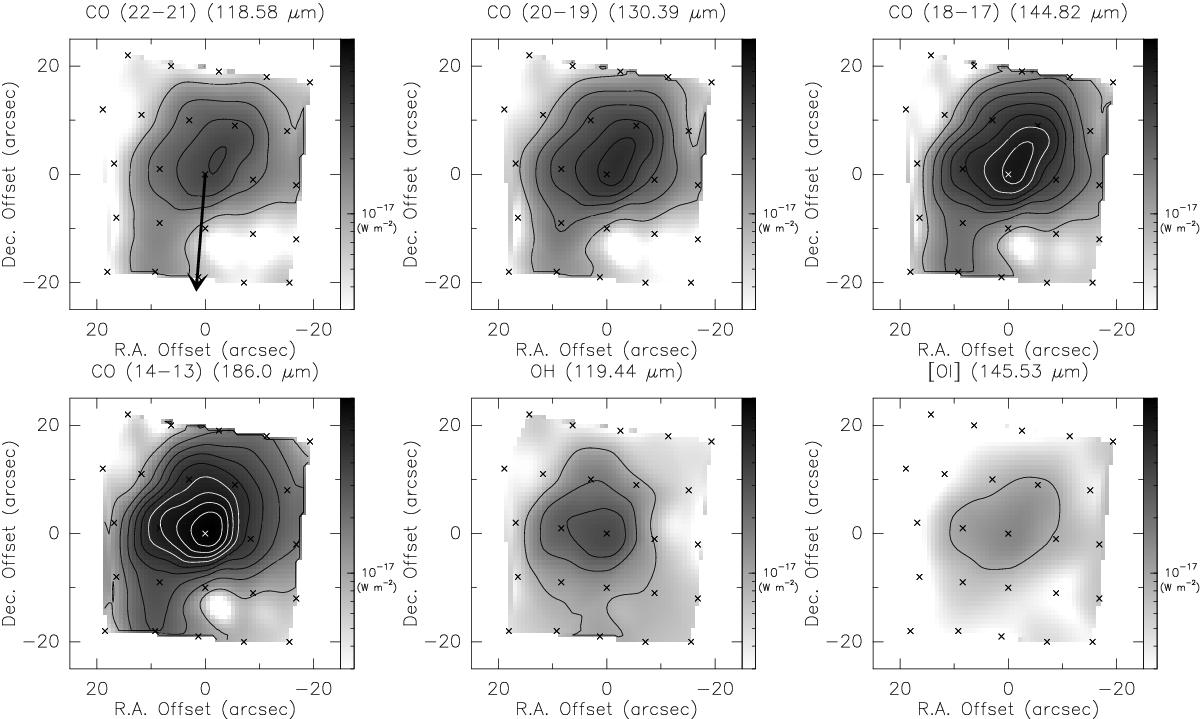
Maps of the four CO lines, OH 119 μm and [O i] 145 μm observed with PACS towards knot A in the red lobe of the IRS1-driven outflow. First level and level steps are 9 × 10-18 W m-2, corresponding to 3σ. The crosses mark the central position of the 25 spatial pixels of the PACS FOV. The arrow in the top left panel indicates the direction of the IRS1 protostar.
Current usage metrics show cumulative count of Article Views (full-text article views including HTML views, PDF and ePub downloads, according to the available data) and Abstracts Views on Vision4Press platform.
Data correspond to usage on the plateform after 2015. The current usage metrics is available 48-96 hours after online publication and is updated daily on week days.
Initial download of the metrics may take a while.