Free Access
Fig. 3

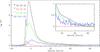
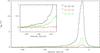
Plot of the lines observed with HIFI towards knot A in the northern lobe (upper panel) and about 15′′ north-east of knot E in the southern lobe (lower panel). Spectra were rebinned at a common spectral resolution of 0.5 km s-1. In the insets a zoom in the lines wings is shown.
This figure is made of several images, please see below:
Current usage metrics show cumulative count of Article Views (full-text article views including HTML views, PDF and ePub downloads, according to the available data) and Abstracts Views on Vision4Press platform.
Data correspond to usage on the plateform after 2015. The current usage metrics is available 48-96 hours after online publication and is updated daily on week days.
Initial download of the metrics may take a while.