Fig. 15
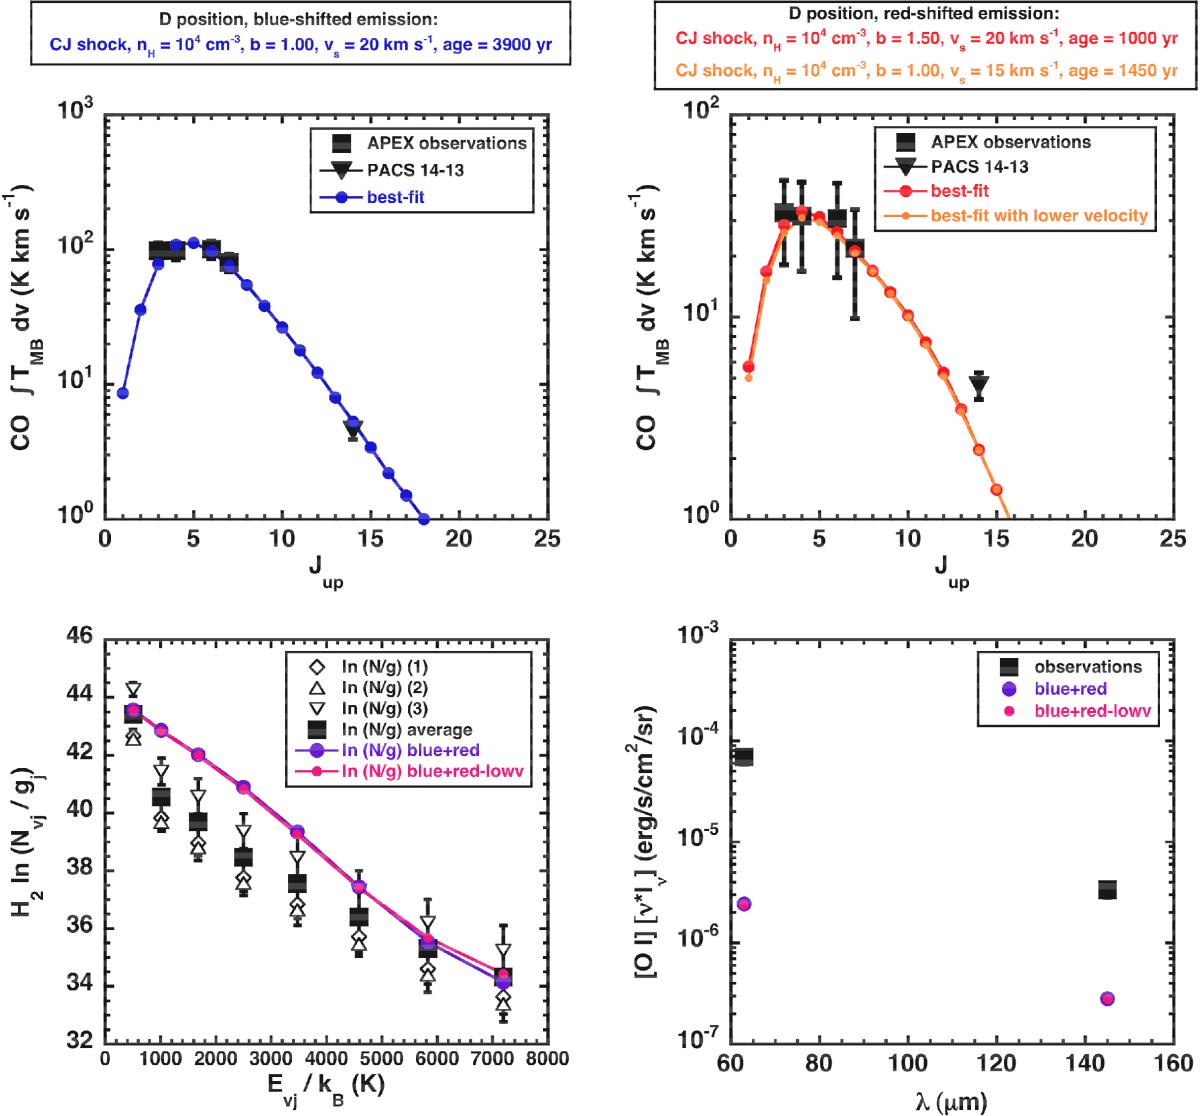
Comparison between the best-fit model (coloured points) from comparisons of a grid of models from the Paris-Durham shock code with observations (black squares) of H2 (from the Spitzer-IRS telescope) and CO (from the APEX telescope). The target position is the southern knot D shock where the blue lobe of the outflow driven by IRS1 overlaps with that driven by IRS2. We consequently fitted two shock layers in this position: one on the red-shifted, one on the blue-shifted gas component. Upper panel, left: CO integrated intensity diagram for the blue component. Upper panel, right: CO integrated intensity diagram for the red component. Lower panel, left: H2 excitation diagram, the three empty symbols correspond to fluxes extracted with different methods (see text for details), the filled squares indicates the average values. Lower panel, right: [O i] line flux.
Current usage metrics show cumulative count of Article Views (full-text article views including HTML views, PDF and ePub downloads, according to the available data) and Abstracts Views on Vision4Press platform.
Data correspond to usage on the plateform after 2015. The current usage metrics is available 48-96 hours after online publication and is updated daily on week days.
Initial download of the metrics may take a while.