Fig. 14
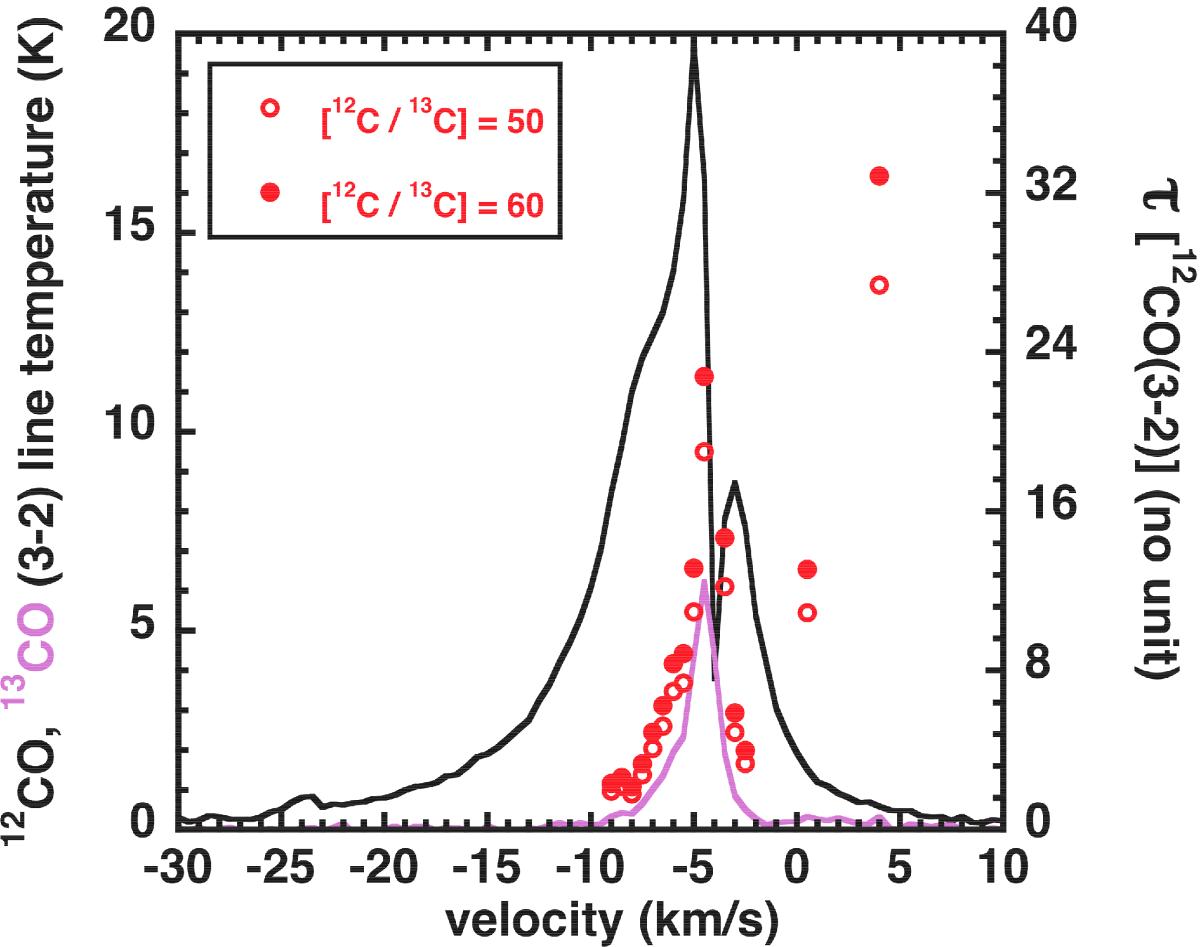
Channel-by-channel optical depth of the CO (3–2) line (right-hand y-axis), obtained under two assumption for the [12CO]/[13CO] relative abundance: 50 and 60 (empty and full red circles), for all channels with at least a 3σ detection in 13CO (3–2). Also shown the 12CO and 13CO (3–2) spectra (in black and pink respectively, left-hand y-axis), obtained in knot D with the APEX telescope.
Current usage metrics show cumulative count of Article Views (full-text article views including HTML views, PDF and ePub downloads, according to the available data) and Abstracts Views on Vision4Press platform.
Data correspond to usage on the plateform after 2015. The current usage metrics is available 48-96 hours after online publication and is updated daily on week days.
Initial download of the metrics may take a while.