Fig. 12
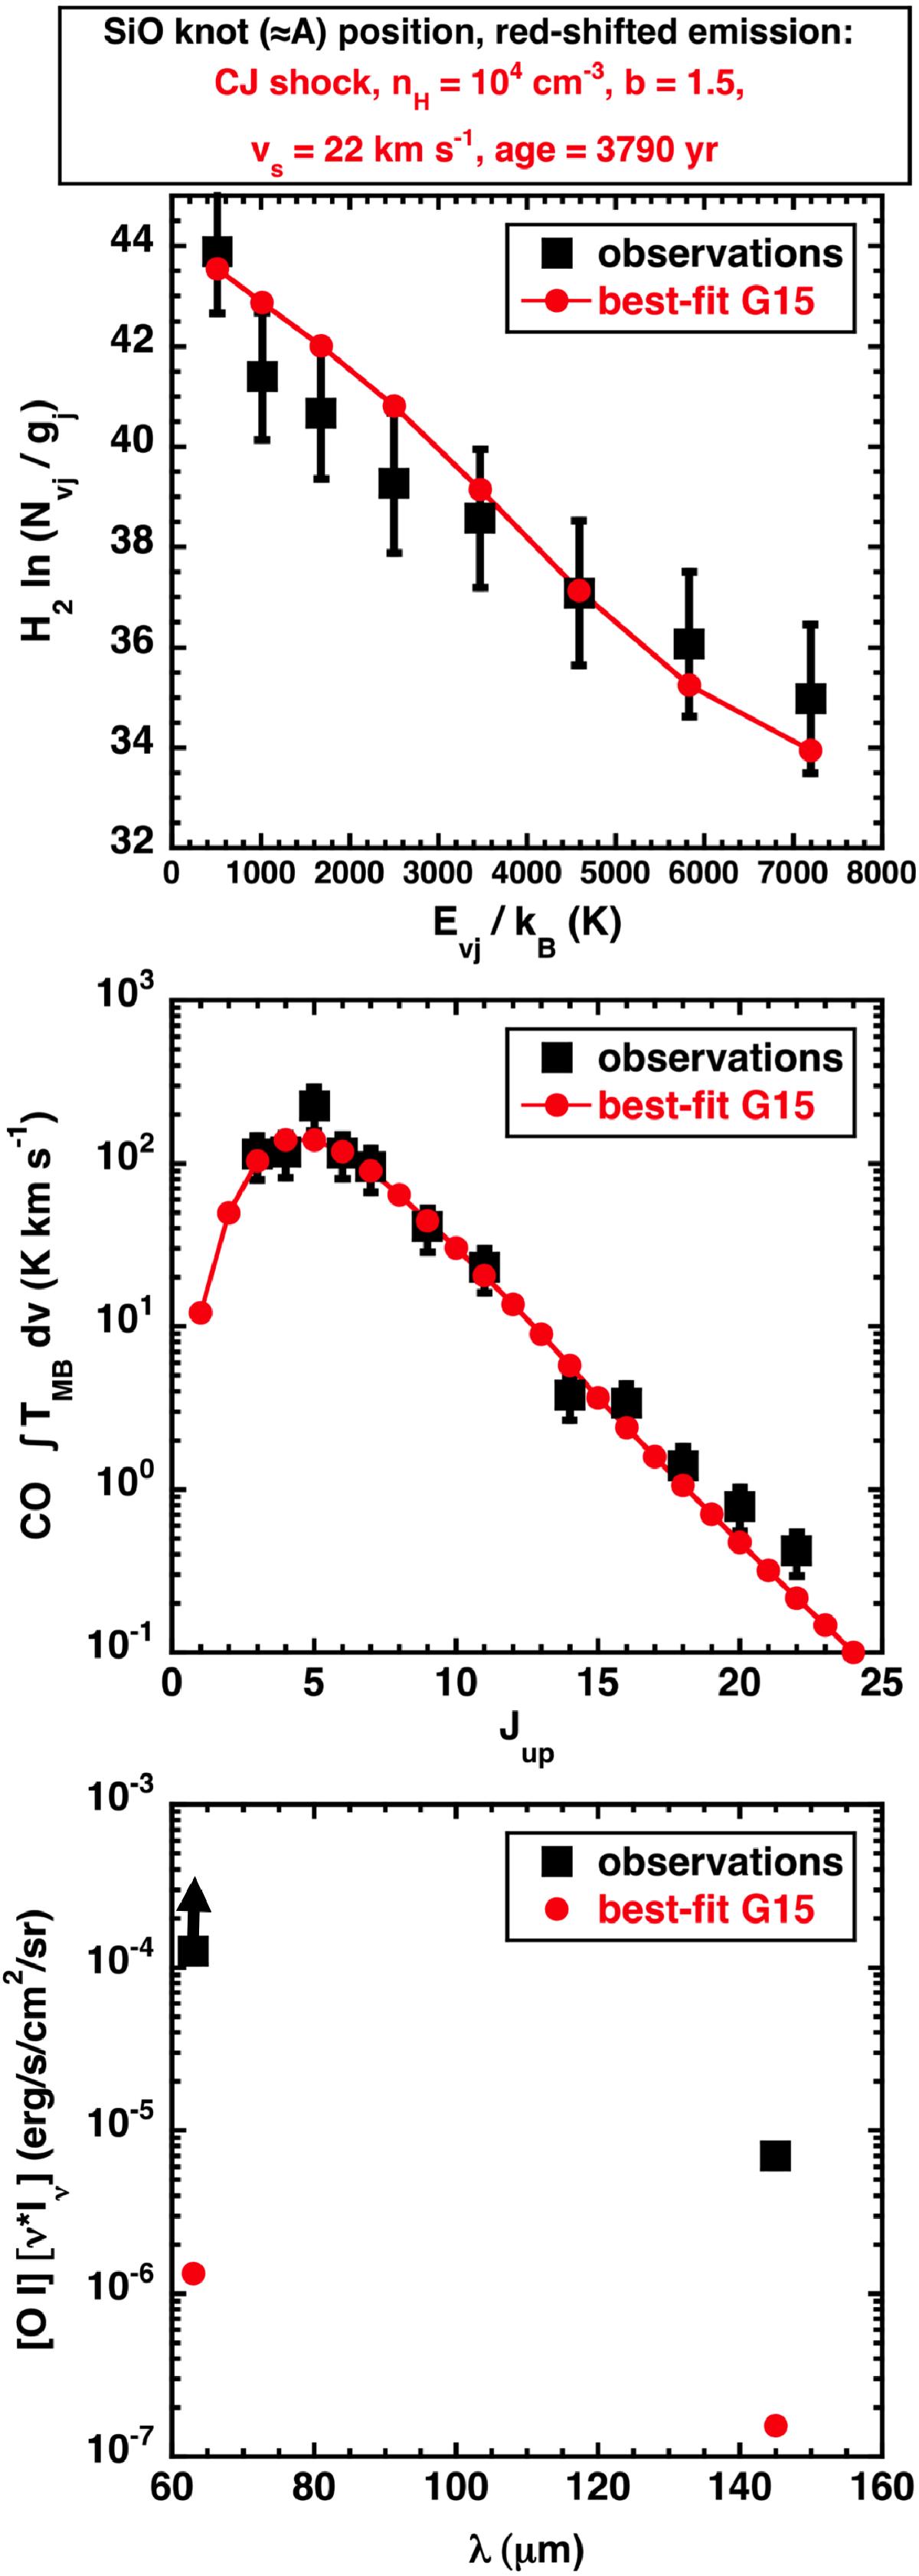
Comparison between the best-fit model (red points) obtained in G15 from comparisons of a grid of models from the Paris-Durham shock code with observations (black squares) of H2 (from the Spitzer-IRS telescope) and CO (from the APEX telescope). The target position is the northern shock called SiO-knot in G15 and roughly corresponding to knot A of the current study. Upper panel: H2 excitation diagram. Middle panel: CO integrated intensity diagram. Lower panel: [O i] line flux. The newly presented CO (5–4, 9–8, 14–13, 18–17, 20–19, and 22–21) transitions observed with Herschel HIFI and PACS have been added to the previously fitted APEX CO lines in the intensity diagram and are satisfactorily fitted by the model.
Current usage metrics show cumulative count of Article Views (full-text article views including HTML views, PDF and ePub downloads, according to the available data) and Abstracts Views on Vision4Press platform.
Data correspond to usage on the plateform after 2015. The current usage metrics is available 48-96 hours after online publication and is updated daily on week days.
Initial download of the metrics may take a while.