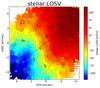
Fig. 9
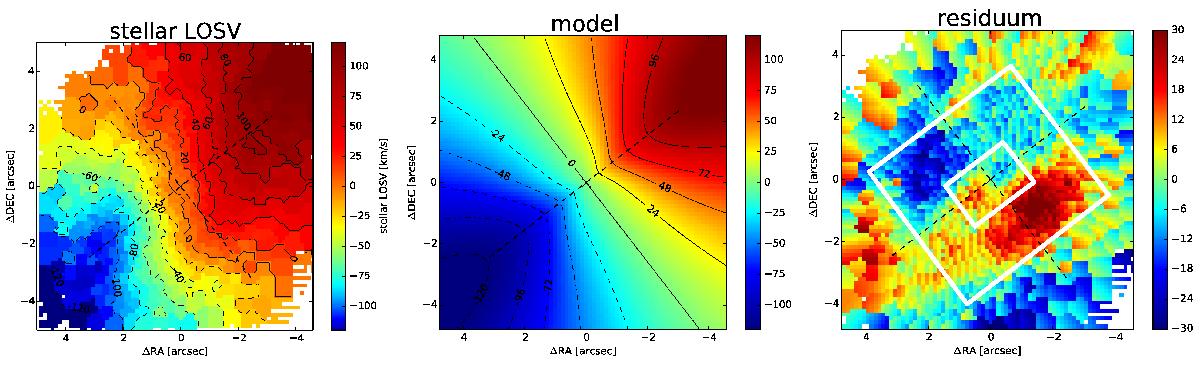
Left: stellar line-of-sight velocity obtained by fitting the region around the CO band heads at 2.3 μm. Middle: rotating disc model fitted to the stellar velocity field. Right: residual between LOSV and model. The residual shows sub-structures that are indicated with white boxes. The cross denotes the peak of the K-band continuum emission, the black dashed lines show the line of nodes and the zero-velocity line of the model.
Current usage metrics show cumulative count of Article Views (full-text article views including HTML views, PDF and ePub downloads, according to the available data) and Abstracts Views on Vision4Press platform.
Data correspond to usage on the plateform after 2015. The current usage metrics is available 48-96 hours after online publication and is updated daily on week days.
Initial download of the metrics may take a while.