Fig. 4
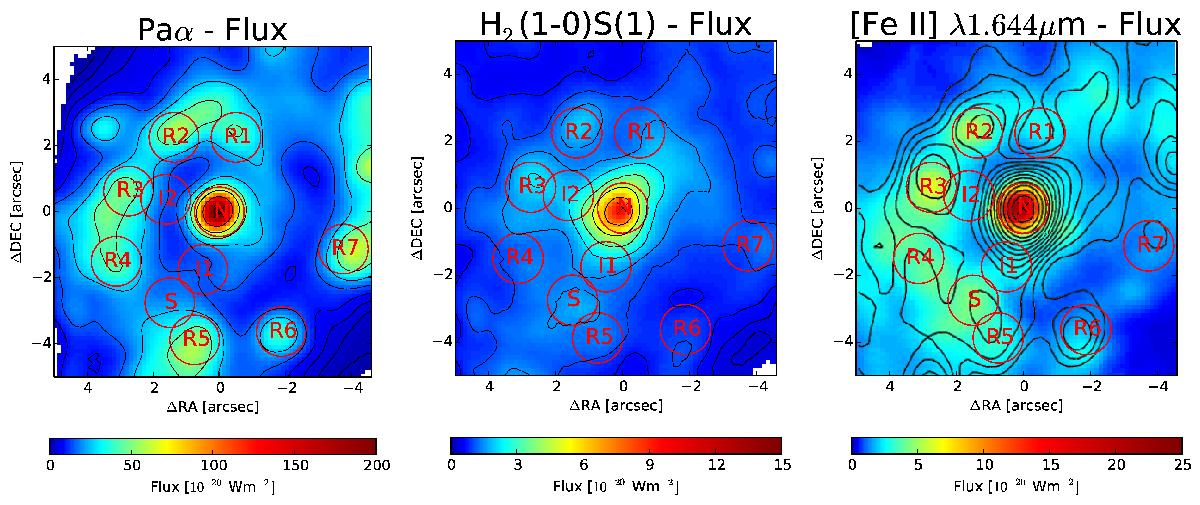
Flux maps of the Paα, H2λ2.12 μm, and [Fe ii]λ1.64 μm emission lines. The [Fe ii] map is overlaid with the 3.6 cm radio-continuum image of Collison et al. (1994) as printed in Kotilainen et al. (1996). The molecular hydrogen shows a more centrally concentrated distribution; this is different from the distribution of ionised hydrogen and the shock tracer [Fe ii] which show emission in the centre, but also in a circumnuclear ring with radius 4″ ≈ 240 pc.
Current usage metrics show cumulative count of Article Views (full-text article views including HTML views, PDF and ePub downloads, according to the available data) and Abstracts Views on Vision4Press platform.
Data correspond to usage on the plateform after 2015. The current usage metrics is available 48-96 hours after online publication and is updated daily on week days.
Initial download of the metrics may take a while.