Fig. 16
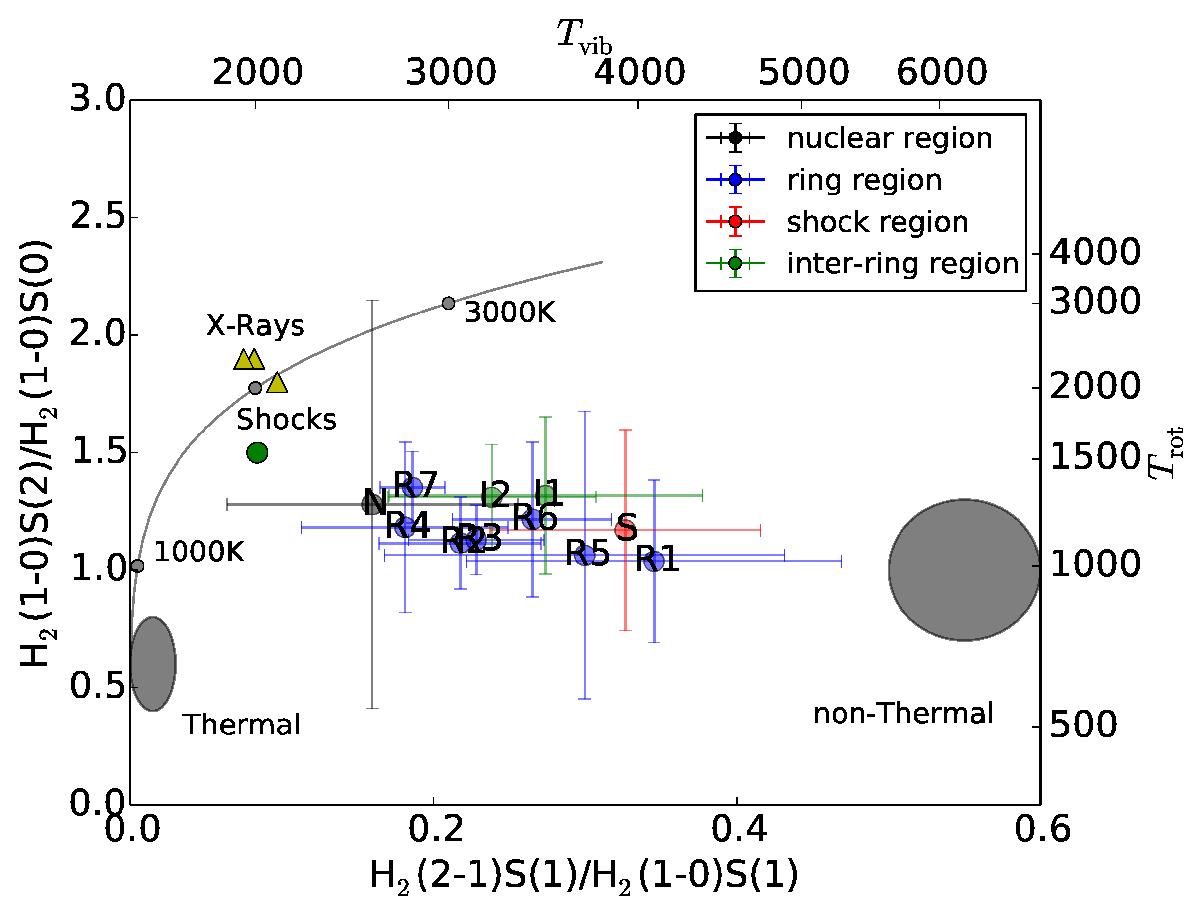
Molecular hydrogen diagnostic diagram with 2-1S(1)/1-0S(1) vs. 1-0S(2)/1-0S(1) (Mouri 1994). The locations of the apertures are indicated. The location of thermal UV excitation (Sternberg & Dalgarno 1989) and non-thermal models (Black & van Dishoeck 1987), as well as the thermal emission curve from 1000 K to 3000 K are plotted in grey. The X-ray heating models (Draine & Woods 1990) are marked by a yellow triangle, the shock-heating model (Brand et al. 1989) by a green circle.
Current usage metrics show cumulative count of Article Views (full-text article views including HTML views, PDF and ePub downloads, according to the available data) and Abstracts Views on Vision4Press platform.
Data correspond to usage on the plateform after 2015. The current usage metrics is available 48-96 hours after online publication and is updated daily on week days.
Initial download of the metrics may take a while.