Fig. 15
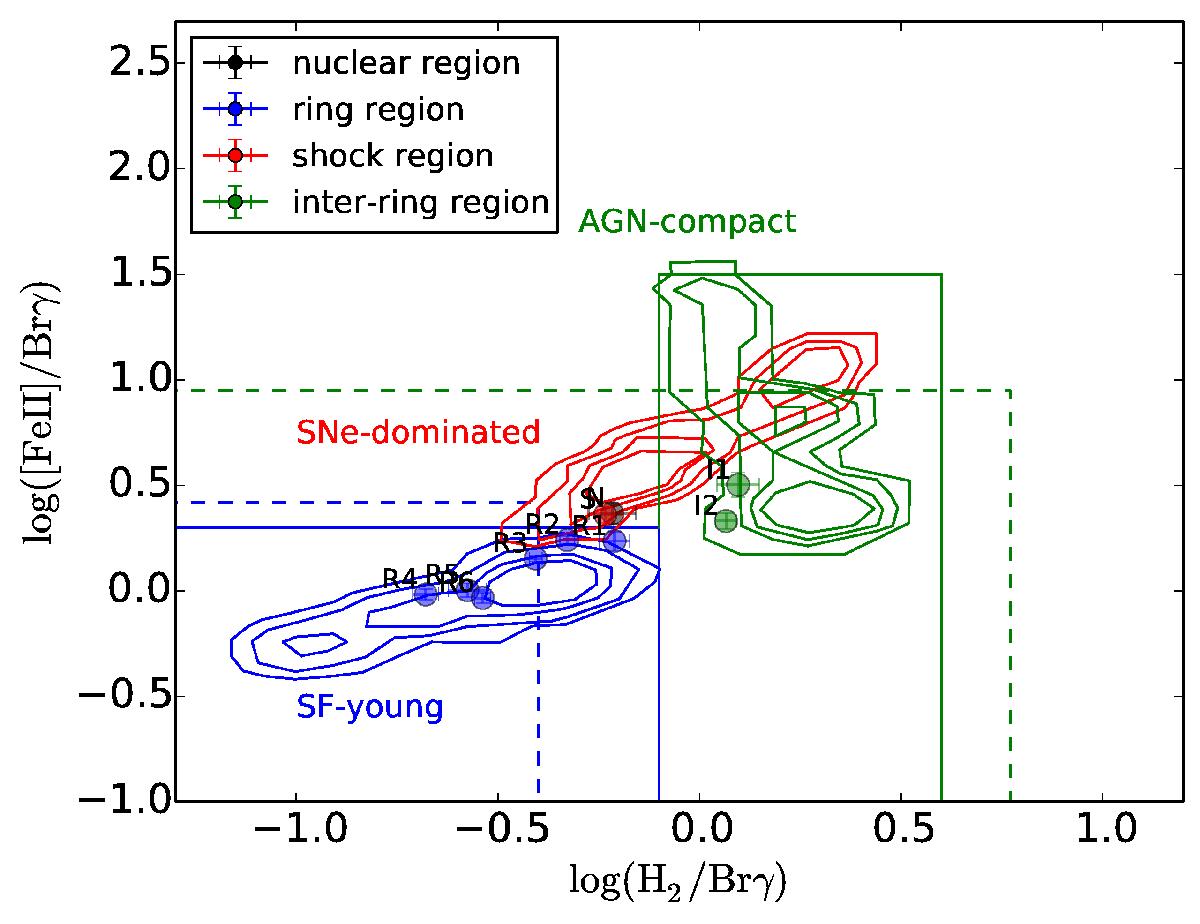
Near-infrared diagnostic diagram with the line ratios log (H2λ2.12 μm/Brγ) vs. log ([ Fe ii ] λ1.644 μm/Brγ). The contours are from Colina et al. (2015) and denote the regions dominated by young star formation, supernovae, and the compact AGN. Solid lines are upper limits for young star-forming regions and AGN from the same study (based on 2D spectroscopy), while the dashed lines denote the upper limits from 1D spectroscopy studies done by Riffel et al. (2013).
Current usage metrics show cumulative count of Article Views (full-text article views including HTML views, PDF and ePub downloads, according to the available data) and Abstracts Views on Vision4Press platform.
Data correspond to usage on the plateform after 2015. The current usage metrics is available 48-96 hours after online publication and is updated daily on week days.
Initial download of the metrics may take a while.