Free Access
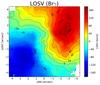
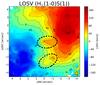
Fig. 10
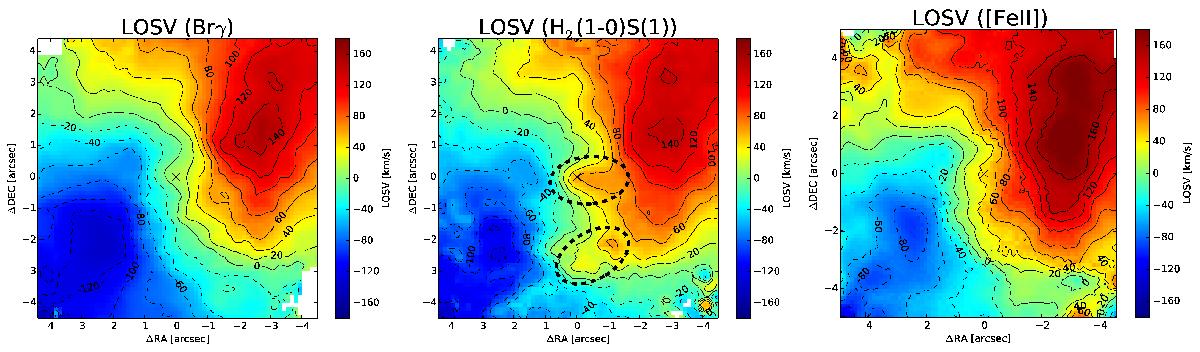
Line-of-sight velocity maps of ionised gas (Brγ), molecular gas (H2λ2.12 μm), and partially ionised gas ([Fe ii] λ1.644 μm). The cross denotes the centre, i.e. the peak of the continuum emission. In the H2 LOSV-map, two elongated features are marked with dashed black ellipses.
This figure is made of several images, please see below:
Current usage metrics show cumulative count of Article Views (full-text article views including HTML views, PDF and ePub downloads, according to the available data) and Abstracts Views on Vision4Press platform.
Data correspond to usage on the plateform after 2015. The current usage metrics is available 48-96 hours after online publication and is updated daily on week days.
Initial download of the metrics may take a while.