Fig. A.2
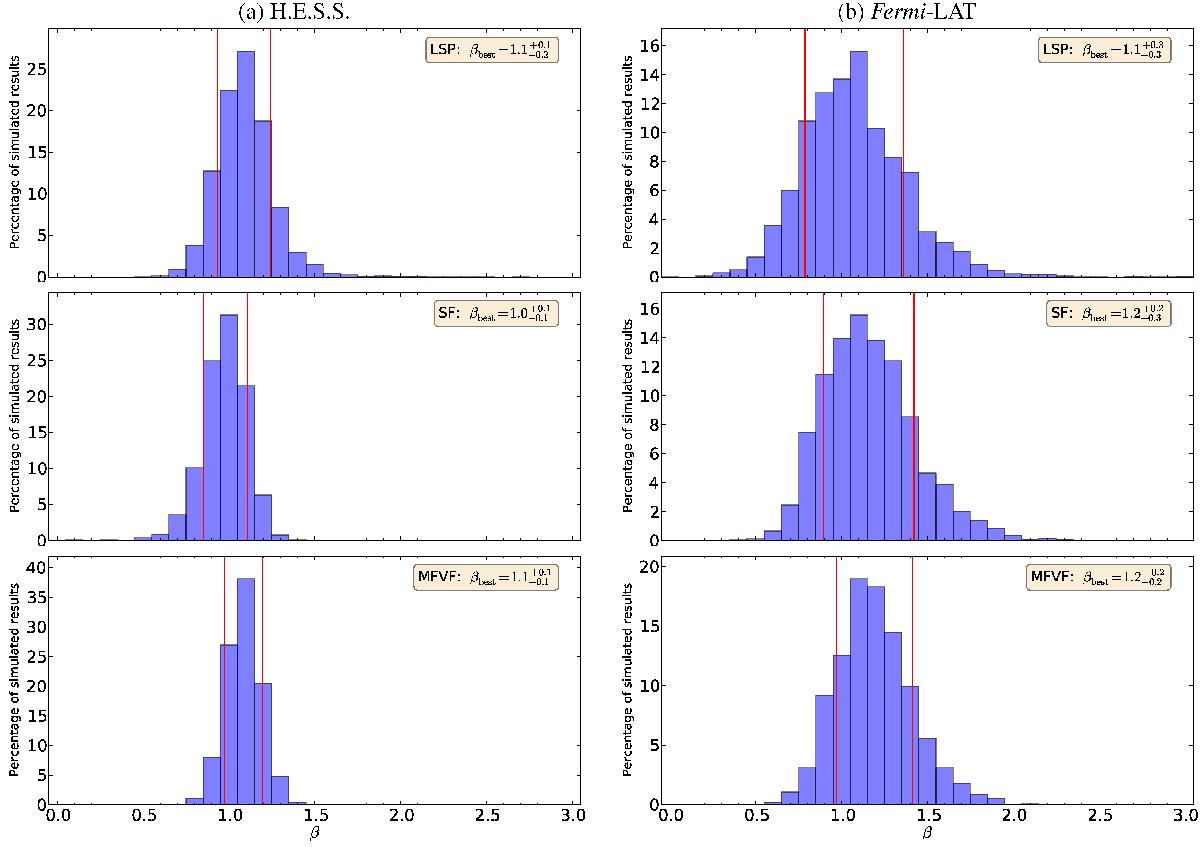
Uncertainties on the LSP, SF, and MFVF best-fit parameters. Left panel a) the histograms represent the distributions of estimates for β for simulated H.E.S.S. light curves with the LSP (top), SF (middle), and MFVF (bottom) respectively. For the simulated light curves, the true value for β is the best-fit value found for the H.E.S.S. light curve. The vertical red bars are the 1σ uncertainties on the best fit obtained from the histograms by removing equal tails. Right panel b) same plots for the Fermi-LAT data.
Current usage metrics show cumulative count of Article Views (full-text article views including HTML views, PDF and ePub downloads, according to the available data) and Abstracts Views on Vision4Press platform.
Data correspond to usage on the plateform after 2015. The current usage metrics is available 48-96 hours after online publication and is updated daily on week days.
Initial download of the metrics may take a while.